Pottery Barn 2009 Annual Report Download - page 35
Download and view the complete annual report
Please find page 35 of the 2009 Pottery Barn annual report below. You can navigate through the pages in the report by either clicking on the pages listed below, or by using the keyword search tool below to find specific information within the annual report.-
 1
1 -
2
-
3
-
4
-
5
-
6
-
7
-
8
-
9
-
10
-
11
-
12
-
13
-
14
-
15
-
16
-
17
-
18
-
19
-
20
-
21
-
22
-
23
-
24
-
 25
25 -
 26
26 -
 27
27 -
 28
28 -
 29
29 -
 30
30 -
 31
31 -
 32
32 -
 33
33 -
 34
34 -
 35
35 -
 36
36 -
 37
37 -
 38
38 -
 39
39 -
 40
40 -
 41
41 -
 42
42 -
 43
43 -
 44
44 -
 45
45 -
46
-
47
-
48
-
49
-
50
-
51
-
52
-
53
-
54
-
55
-
56
-
57
-
58
-
59
-
60
-
61
-
62
-
63
-
64
-
65
-
66
-
67
-
68
-
69
-
70
-
71
-
72
-
73
-
74
-
75
-
76
-
77
-
78
-
79
-
80
-
81
-
82
-
83
-
84
-
85
-
86
-
87
-
88
-
89
-
90
-
91
-
92
-
93
-
94
-
95
-
96
-
97
-
98
-
99
-
100
-
101
-
102
-
103
-
104
-
105
-
106
-
107
-
108
-
109
-
110
-
111
-
112
-
113
-
114
-
115
-
116
-
117
-
118
-
119
-
120
-
121
-
122
-
123
-
124
-
125
-
126
-
127
-
128
-
129
-
130
-
131
-
132
-
133
-
134
-
135
-
136
-
137
-
138
-
139
-
140
-
141
-
142
-
143
-
144
-
145
-
146
-
147
-
148
-
149
-
150
-
151
-
152
-
153
-
154
-
155
-
156
-
157
-
158
-
159
-
160
-
161
-
162
-
163
-
164
-
165
-
166
-
167
-
168
-
169
-
170
-
171
-
172
-
173
-
174
-
175
-
176
-
177
-
178
-
179
-
180
-
181
-
182
-
183
-
184
-
185
-
186
-
187
-
188
-
189
-
190
-
191
-
192
-
193
-
194
-
195
-
196
-
197
-
198
-
199
-
200
 |
 |

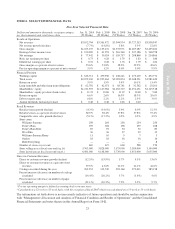
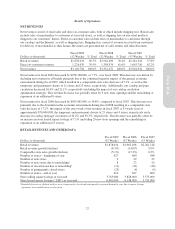
ITEM 6. SELECTED FINANCIAL DATA
Five-Year Selected Financial Data
Dollars and amounts in thousands, except percentages,
per share amounts and retail stores data
Jan. 31, 2010
(52 Weeks)
Feb. 1, 2009
(52 Weeks)
Feb. 3, 2008
(53 Weeks)
Jan. 28, 2007
(52 Weeks)
Jan. 29, 2006
(52 Weeks)
Results of Operations
Net revenues $3,102,704 $3,361,472 $3,944,934 $3,727,513 $3,538,947
Net revenue growth (decline) (7.7%) (14.8%) 5.8% 5.3% 12.8%
Gross margin $1,103,237 $1,135,172 $1,535,971 $1,487,287 $1,435,482
Earnings before income taxes $ 120,289 $ 41,953 $ 316,340 $ 337,186 $ 348,798
Net earnings $ 77,442 $ 30,024 $ 195,757 $ 208,868 $ 214,866
Basic net earnings per share $ 0.73 $ 0.28 $ 1.79 $ 1.83 $ 1.86
Diluted net earnings per share $ 0.72 $ 0.28 $ 1.76 $ 1.79 $ 1.81
Gross margin as a percent of net revenues 35.6% 33.8% 38.9% 39.9% 40.6%
Pre-tax operating margin as a percent of net revenues13.9% 1.2% 8.0% 9.0% 9.9%
Financial Position
Working capital $ 616,711 $ 479,936 $ 438,241 $ 473,229 $ 492,772
Total assets $2,079,169 $1,935,464 $2,093,854 $2,048,331 $1,981,620
Return on assets 3.9% 1.5% 9.4% 10.1% 11.4%
Long-term debt and other long-term obligations $ 62,792 $ 62,071 $ 68,761 $ 32,562 $ 29,201
Shareholders’ equity $1,211,595 $1,147,984 $1,165,723 $1,151,431 $1,125,318
Shareholders’ equity per share (book value) $ 11.33 $ 10.86 $ 11.07 $ 10.48 $ 9.80
Return on equity 6.6% 2.6% 16.9% 18.3% 20.6%
Debt-to-equity ratio 0.8% 2.2% 2.2% 2.5% 3.0%
Annual dividends declared per share $ 0.48 $ 0.48 $ 0.46 $ 0.40 —
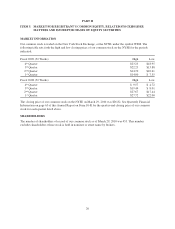
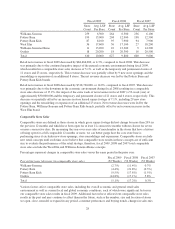
Retail Revenues
Retail revenue growth (decline) (4.3%) (14.0%) 5.9% 6.0% 12.3%
Retail revenues as a percent of net revenues 60.5% 58.4% 57.8% 57.8% 57.4%
Comparable store sales growth (decline)2(5.1%) (17.2%) 0.3% 0.3% 4.9%
Store count
Williams-Sonoma 259 264 256 254 254
Pottery Barn 199 204 198 197 188
Pottery Barn Kids 87 95 94 92 89
West Elm 36 36 27 22 12
Williams-Sonoma Home 11 10 9 7 3
Outlets 18 18 16 16 16
Hold Everything — — — — 8
Number of stores at year-end 610 627 600 588 570
Store selling area at fiscal year-end (sq. ft.) 3,763,000 3,828,000 3,575,000 3,389,000 3,140,000
Store leased area at fiscal year-end (sq. ft.) 6,081,000 6,148,000 5,739,000 5,451,000 5,035,000
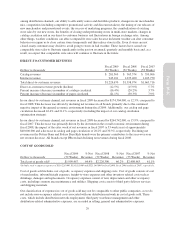
Direct-to-Customer Revenues
Direct-to-customer revenue growth (decline) (12.5%) (15.9%) 5.7% 4.5% 13.6%
Direct-to-customer revenues as a percent of net
revenues 39.5% 41.6% 42.2% 42.2% 42.6%
Catalogs circulated during the year 262,351 313,740 393,160 379,011 385,158
Percent increase (decrease) in number of catalogs
circulated (16.4%) (20.2%) 3.7% (1.6%) 4.6%
Percent increase (decrease) in number of pages
circulated (21.1%) (30.3%) 7.9% 3.2% 9.7%
1Pre-tax operating margin is defined as earnings before income taxes.
2Calculated on a 52-week to 52-week basis, with the exception of fiscal 2007 which was calculated on a 53-week to 53-week basis.
The information set forth above is not necessarily indicative of future operations and should be read in conjunction
with “Management’s Discussion and Analysis of Financial Condition and Results of Operations” and the Consolidated
Financial Statements and notes thereto in this Annual Report on Form 10-K.
23
Form 10-K