Pottery Barn 2009 Annual Report Download - page 55
Download and view the complete annual report
Please find page 55 of the 2009 Pottery Barn annual report below. You can navigate through the pages in the report by either clicking on the pages listed below, or by using the keyword search tool below to find specific information within the annual report.-
 1
1 -
2
-
3
-
4
-
5
-
6
-
7
-
8
-
9
-
10
-
11
-
12
-
13
-
14
-
15
-
16
-
17
-
18
-
19
-
20
-
21
-
22
-
23
-
24
-
25
-
26
-
27
-
28
-
29
-
30
-
31
-
32
-
33
-
34
-
35
-
36
-
37
-
38
-
39
-
40
-
41
-
42
-
43
-
44
-
 45
45 -
 46
46 -
 47
47 -
 48
48 -
 49
49 -
 50
50 -
 51
51 -
 52
52 -
 53
53 -
 54
54 -
 55
55 -
 56
56 -
 57
57 -
 58
58 -
 59
59 -
 60
60 -
 61
61 -
 62
62 -
 63
63 -
 64
64 -
 65
65 -
66
-
67
-
68
-
69
-
70
-
71
-
72
-
73
-
74
-
75
-
76
-
77
-
78
-
79
-
80
-
81
-
82
-
83
-
84
-
85
-
86
-
87
-
88
-
89
-
90
-
91
-
92
-
93
-
94
-
95
-
96
-
97
-
98
-
99
-
100
-
101
-
102
-
103
-
104
-
105
-
106
-
107
-
108
-
109
-
110
-
111
-
112
-
113
-
114
-
115
-
116
-
117
-
118
-
119
-
120
-
121
-
122
-
123
-
124
-
125
-
126
-
127
-
128
-
129
-
130
-
131
-
132
-
133
-
134
-
135
-
136
-
137
-
138
-
139
-
140
-
141
-
142
-
143
-
144
-
145
-
146
-
147
-
148
-
149
-
150
-
151
-
152
-
153
-
154
-
155
-
156
-
157
-
158
-
159
-
160
-
161
-
162
-
163
-
164
-
165
-
166
-
167
-
168
-
169
-
170
-
171
-
172
-
173
-
174
-
175
-
176
-
177
-
178
-
179
-
180
-
181
-
182
-
183
-
184
-
185
-
186
-
187
-
188
-
189
-
190
-
191
-
192
-
193
-
194
-
195
-
196
-
197
-
198
-
199
-
200
 |
 |

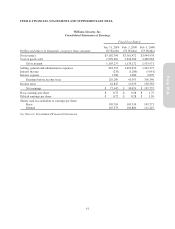
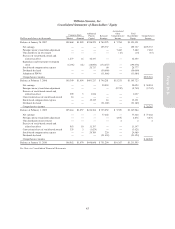
Williams-Sonoma, Inc.
Consolidated Statements of Shareholders’ Equity
Common Stock Additional
Paid-in
Capital
Retained
Earnings
Accumulated
Other
Comprehensive
Income
Total
Shareholders’
Equity
Comprehensive
Income
Dollars and shares in thousands Shares Amount
Balance at January 28, 2007 109,868 $1,099 $358,223 $ 784,325 $ 7,784 $1,151,431
Net earnings — — — 195,757 — 195,757 $195,757
Foreign currency translation adjustment — — — — 7,482 7,482 7,482
Unrealized loss on investment — — — — (15) (15) (15)
Exercise of stock-based awards and
related tax effect 1,677 16 36,337 — — 36,353
Repurchase and retirement of common
stock (6,196) (61) (18,060) (172,257) — (190,378)
Stock-based compensation expense 26,717 60 — 26,777
Dividends declared — — — (50,000) — (50,000)
Adoption of FIN 48 — — — (11,684) — (11,684)
Comprehensive income $203,224
Balance at February 3, 2008 105,349 $1,054 $403,217 $ 746,201 $15,251 $1,165,723
Net earnings — — — 30,024 — 30,024 $ 30,024
Foreign currency translation adjustment — — — — (9,742) (9,742) (9,742)
Exercise of stock-based awards and
related tax effect 299 3 1,034 — — 1,037
Conversion/release of stock-based awards 16 — — — — —
Stock-based compensation expense — — 12,115 16 — 12,131
Dividends declared — — — (51,189) — (51,189)
Comprehensive income $ 20,282
Balance at February 1, 2009 105,664 $1,057 $416,366 $ 725,052 $ 5,509 $1,147,984
Net earnings — — — 77,442 — 77,442 $ 77,442
Foreign currency translation adjustment — — — — 4,876 4,876 4,876
Unrealized gain on investment — — — — 2 2 2
Exercise of stock-based awards and
related tax effect 963 10 11,337 — — 11,347
Conversion/release of stock-based awards 335 3 (3,624) — — (3,621)
Stock-based compensation expense — — 24,769 220 — 24,989
Dividends declared — — — (51,424) — (51,424)
Comprehensive income $ 82,320
Balance at January 31, 2010 106,962 $1,070 $448,848 $ 751,290 $10,387 $1,211,595
See Notes to Consolidated Financial Statements.
43
Form 10-K