Pottery Barn 2009 Annual Report Download - page 73
Download and view the complete annual report
Please find page 73 of the 2009 Pottery Barn annual report below. You can navigate through the pages in the report by either clicking on the pages listed below, or by using the keyword search tool below to find specific information within the annual report.-
 1
1 -
2
-
3
-
4
-
5
-
6
-
7
-
8
-
9
-
10
-
11
-
12
-
13
-
14
-
15
-
16
-
17
-
18
-
19
-
20
-
21
-
22
-
23
-
24
-
25
-
26
-
27
-
28
-
29
-
30
-
31
-
32
-
33
-
34
-
35
-
36
-
37
-
38
-
39
-
40
-
41
-
42
-
43
-
44
-
45
-
46
-
47
-
48
-
49
-
50
-
51
-
52
-
53
-
54
-
55
-
56
-
57
-
58
-
59
-
60
-
61
-
62
-
 63
63 -
 64
64 -
 65
65 -
 66
66 -
 67
67 -
 68
68 -
 69
69 -
 70
70 -
 71
71 -
 72
72 -
 73
73 -
 74
74 -
 75
75 -
 76
76 -
 77
77 -
 78
78 -
 79
79 -
 80
80 -
 81
81 -
 82
82 -
 83
83 -
84
-
85
-
86
-
87
-
88
-
89
-
90
-
91
-
92
-
93
-
94
-
95
-
96
-
97
-
98
-
99
-
100
-
101
-
102
-
103
-
104
-
105
-
106
-
107
-
108
-
109
-
110
-
111
-
112
-
113
-
114
-
115
-
116
-
117
-
118
-
119
-
120
-
121
-
122
-
123
-
124
-
125
-
126
-
127
-
128
-
129
-
130
-
131
-
132
-
133
-
134
-
135
-
136
-
137
-
138
-
139
-
140
-
141
-
142
-
143
-
144
-
145
-
146
-
147
-
148
-
149
-
150
-
151
-
152
-
153
-
154
-
155
-
156
-
157
-
158
-
159
-
160
-
161
-
162
-
163
-
164
-
165
-
166
-
167
-
168
-
169
-
170
-
171
-
172
-
173
-
174
-
175
-
176
-
177
-
178
-
179
-
180
-
181
-
182
-
183
-
184
-
185
-
186
-
187
-
188
-
189
-
190
-
191
-
192
-
193
-
194
-
195
-
196
-
197
-
198
-
199
-
200
 |
 |

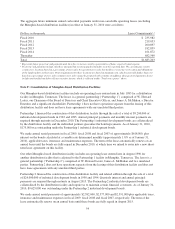
Note N: Infrastructure Cost Reduction Program
On January 21, 2009, we announced a series of actions completed during the fourth quarter of fiscal 2008 to
reduce our fiscal 2009 fixed and semi-fixed overhead costs by approximately $75,000,000. These actions
included an approximate 18% reduction in company-wide full time headcount (approximately 1,400 positions),
the closure of our Camp Hill, Pennsylvania customer care center and the closure of a 500,000 square foot
distribution facility in Memphis, Tennessee. In connection with this cost reduction program, we incurred
approximately $12,734,000 in severance and lease termination related expenses in the fourth quarter of fiscal
2008. Approximately $2,390,000 of these expenses was recorded within cost of goods sold and $10,344,000 was
recorded within selling, general and administrative expenses.
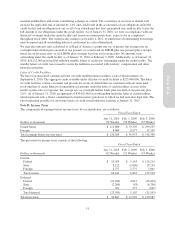
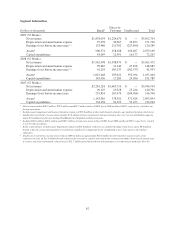
Note O: Segment Reporting
We have two reportable segments, retail and direct-to-customer. The retail segment has five merchandising
concepts which sell products for the home (Williams-Sonoma, Pottery Barn, Pottery Barn Kids, West Elm and
Williams-Sonoma Home). The five retail merchandising concepts are operating segments, which have been
aggregated into one reportable segment, retail. The direct-to-customer segment has six merchandising concepts
(Williams-Sonoma, Pottery Barn, Pottery Barn Kids, PBteen, West Elm and Williams-Sonoma Home) and sells
similar products through our seven direct mail catalogs (Williams-Sonoma, Pottery Barn, Pottery Barn Kids,
Pottery Barn Bed and Bath, PBteen, West Elm and Williams-Sonoma Home) and six e-commerce websites
(williams-sonoma.com, potterybarn.com, potterybarnkids.com, pbteen.com, westelm.com and wshome.com).
Management’s expectation is that the overall economic characteristics of each of our major concepts within each
reportable segment will be similar over time based on management’s judgment that the operating segments have
had similar historical economic characteristics and are expected to have similar long-term financial performance
in the future.
These reportable segments are strategic business units that offer similar home-centered products. They are
managed separately because the business units utilize two distinct distribution and marketing strategies. Based on
management’s best estimate, our operating segments include allocations of certain expenses, including
advertising and employment costs, to the extent they have been determined to benefit both channels. These
operating segments are aggregated at the channel level for reporting purposes due to the fact that our brands are
interdependent for economies of scale and we do not maintain fully allocated income statements at the brand
level. As a result, material financial decisions related to the brands are made at the channel level. Furthermore, it
is not practicable for us to report revenue by product group.
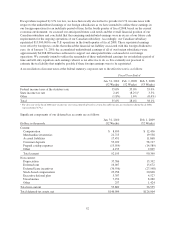
We use earnings before unallocated corporate overhead, interest and taxes to evaluate segment profitability.
Unallocated costs before income taxes include corporate employee-related costs, occupancy expenses (including
depreciation expense), administrative costs and third party service costs, primarily in our corporate systems,
corporate facilities and other administrative departments. Unallocated assets include the net book value of
corporate facilities and related information systems, deferred income taxes, other corporate long-lived assets and
corporate cash and cash equivalents.
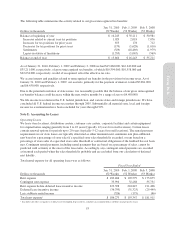
Income tax information by segment has not been included as taxes are calculated at a company-wide level and
are not allocated to each segment.
61
Form 10-K