Pottery Barn 2009 Annual Report Download - page 40
Download and view the complete annual report
Please find page 40 of the 2009 Pottery Barn annual report below. You can navigate through the pages in the report by either clicking on the pages listed below, or by using the keyword search tool below to find specific information within the annual report.-
 1
1 -
2
-
3
-
4
-
5
-
6
-
7
-
8
-
9
-
10
-
11
-
12
-
13
-
14
-
15
-
16
-
17
-
18
-
19
-
20
-
21
-
22
-
23
-
24
-
25
-
26
-
27
-
28
-
29
-
 30
30 -
 31
31 -
 32
32 -
 33
33 -
 34
34 -
 35
35 -
 36
36 -
 37
37 -
 38
38 -
 39
39 -
 40
40 -
 41
41 -
 42
42 -
 43
43 -
 44
44 -
 45
45 -
 46
46 -
 47
47 -
 48
48 -
 49
49 -
 50
50 -
51
-
52
-
53
-
54
-
55
-
56
-
57
-
58
-
59
-
60
-
61
-
62
-
63
-
64
-
65
-
66
-
67
-
68
-
69
-
70
-
71
-
72
-
73
-
74
-
75
-
76
-
77
-
78
-
79
-
80
-
81
-
82
-
83
-
84
-
85
-
86
-
87
-
88
-
89
-
90
-
91
-
92
-
93
-
94
-
95
-
96
-
97
-
98
-
99
-
100
-
101
-
102
-
103
-
104
-
105
-
106
-
107
-
108
-
109
-
110
-
111
-
112
-
113
-
114
-
115
-
116
-
117
-
118
-
119
-
120
-
121
-
122
-
123
-
124
-
125
-
126
-
127
-
128
-
129
-
130
-
131
-
132
-
133
-
134
-
135
-
136
-
137
-
138
-
139
-
140
-
141
-
142
-
143
-
144
-
145
-
146
-
147
-
148
-
149
-
150
-
151
-
152
-
153
-
154
-
155
-
156
-
157
-
158
-
159
-
160
-
161
-
162
-
163
-
164
-
165
-
166
-
167
-
168
-
169
-
170
-
171
-
172
-
173
-
174
-
175
-
176
-
177
-
178
-
179
-
180
-
181
-
182
-
183
-
184
-
185
-
186
-
187
-
188
-
189
-
190
-
191
-
192
-
193
-
194
-
195
-
196
-
197
-
198
-
199
-
200
 |
 |

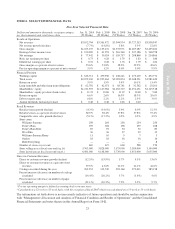
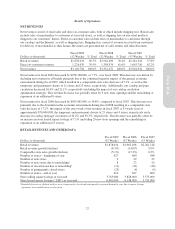
Fiscal 2009 Fiscal 2008 Fiscal 2007
Store
Count
Avg. LSF
Per Store
Store
Count
Avg. LSF
Per Store
Store
Count
Avg. LSF
Per Store
Williams-Sonoma 259 6,300 264 6,300 256 6,100
Pottery Barn 199 13,000 204 12,900 198 12,500
Pottery Barn Kids 87 8,100 95 7,900 94 7,900
West Elm 36 17,600 36 17,100 27 18,200
Williams-Sonoma Home 11 13,200 10 13,300 9 14,300
Outlets 18 20,200 18 20,300 16 20,500
Total 610 10,000 627 9,800 600 9,600
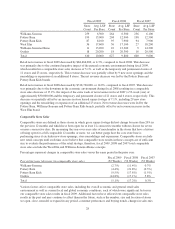
Retail net revenues in fiscal 2009 decreased by $84,464,000, or 4.3%, compared to fiscal 2008. This decrease
was primarily due to the continued negative impact of the general economic environment during fiscal 2009,
which resulted in a comparable store sales decrease of 5.1%, as well as the temporary and permanent closure of
11 stores and 23 stores, respectively. This revenue decrease was partially offset by 9 new store openings and the
remodeling or expansion of an additional 8 stores. The net revenue decrease was led by the Pottery Barn and
Pottery Barn Kids brands.
Retail net revenues in fiscal 2008 decreased by $318,720,000, or 14.0%, compared to fiscal 2007. This decrease
was primarily due to the downturn in the economic environment during fiscal 2008 resulting in a comparable
store sales decrease of 17.2%, the impact of the extra week of net revenues in fiscal 2007 (a 53-week year) of
approximately $30,000,000 and the temporary and permanent closure of 21 stores and 4 stores, respectively. This
decrease was partially offset by an increase in store leased square footage of 7.1%, including 29 new store
openings and the remodeling or expansion of an additional 23 stores. Net revenue decreases were led by the
Pottery Barn, Williams-Sonoma and Pottery Barn Kids brands, partially offset by net revenue increases in the
West Elm brand.
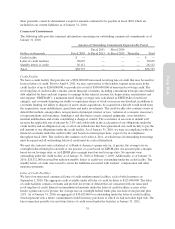
Comparable Store Sales
Comparable stores are defined as those stores in which gross square footage did not change by more than 20% in
the previous 12 months and which have been open for at least 12 consecutive months without closure for seven
or more consecutive days. By measuring the year-over-year sales of merchandise in the stores that have a history
of being open for a full comparable 12 months or more, we can better gauge how the core store base is
performing since it excludes new store openings, store remodelings and expansions. Comparable stores exclude
new retail concepts until such time as we believe that comparable store results in those concepts are of sufficient
size to evaluate the performance of the retail strategy, therefore, fiscal 2009, 2008 and 2007 total comparable
store sales exclude the West Elm and Williams-Sonoma Home concepts.
Percentages represent changes in comparable store sales versus the same period in the prior year.
Percent increase (decrease) in comparable store sales
Fiscal 2009
(52 Weeks)
Fiscal 2008
(52 Weeks)
Fiscal 2007
(53 Weeks)
Williams-Sonoma (2.7%) (11.4%) 0.7%
Pottery Barn (4.4%) (21.8%) (0.3%)
Pottery Barn Kids (9.5%) (17.8%) (1.5%)
Outlets (14.8%) (17.1%) 5.8%
Total (5.1%) (17.2%) 0.3%
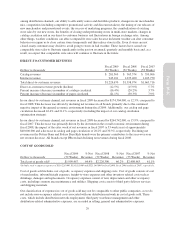
Various factors affect comparable store sales, including the overall economic and general retail sales
environment as well as current local and global economic conditions, each of which were significant factors in
our comparable store sales results in fiscal 2009. Additional factors have affected our comparable store sales
results in the past and may continue to affect them in the future, such as the number, size and location of stores
we open, close, remodel or expand in any period, consumer preferences and buying trends, changes in sales mix
28