Pottery Barn 2009 Annual Report Download - page 42
Download and view the complete annual report
Please find page 42 of the 2009 Pottery Barn annual report below. You can navigate through the pages in the report by either clicking on the pages listed below, or by using the keyword search tool below to find specific information within the annual report.-
 1
1 -
2
-
3
-
4
-
5
-
6
-
7
-
8
-
9
-
10
-
11
-
12
-
13
-
14
-
15
-
16
-
17
-
18
-
19
-
20
-
21
-
22
-
23
-
24
-
25
-
26
-
27
-
28
-
29
-
30
-
31
-
 32
32 -
 33
33 -
 34
34 -
 35
35 -
 36
36 -
 37
37 -
 38
38 -
 39
39 -
 40
40 -
 41
41 -
 42
42 -
 43
43 -
 44
44 -
 45
45 -
 46
46 -
 47
47 -
 48
48 -
 49
49 -
 50
50 -
 51
51 -
 52
52 -
53
-
54
-
55
-
56
-
57
-
58
-
59
-
60
-
61
-
62
-
63
-
64
-
65
-
66
-
67
-
68
-
69
-
70
-
71
-
72
-
73
-
74
-
75
-
76
-
77
-
78
-
79
-
80
-
81
-
82
-
83
-
84
-
85
-
86
-
87
-
88
-
89
-
90
-
91
-
92
-
93
-
94
-
95
-
96
-
97
-
98
-
99
-
100
-
101
-
102
-
103
-
104
-
105
-
106
-
107
-
108
-
109
-
110
-
111
-
112
-
113
-
114
-
115
-
116
-
117
-
118
-
119
-
120
-
121
-
122
-
123
-
124
-
125
-
126
-
127
-
128
-
129
-
130
-
131
-
132
-
133
-
134
-
135
-
136
-
137
-
138
-
139
-
140
-
141
-
142
-
143
-
144
-
145
-
146
-
147
-
148
-
149
-
150
-
151
-
152
-
153
-
154
-
155
-
156
-
157
-
158
-
159
-
160
-
161
-
162
-
163
-
164
-
165
-
166
-
167
-
168
-
169
-
170
-
171
-
172
-
173
-
174
-
175
-
176
-
177
-
178
-
179
-
180
-
181
-
182
-
183
-
184
-
185
-
186
-
187
-
188
-
189
-
190
-
191
-
192
-
193
-
194
-
195
-
196
-
197
-
198
-
199
-
200
 |
 |

Within our reportable segments, the direct-to-customer channel does not incur freight-to-store or store occupancy
expenses, and typically operates with lower markdowns and inventory shrinkage than the retail channel.
However, the direct-to-customer channel incurs higher customer shipping, damage and replacement costs than
the retail channel.
Fiscal 2009 vs. Fiscal 2008
Cost of goods sold decreased by $226,833,000, or 10.2%, in fiscal 2009 compared to fiscal 2008. Including
expense of approximately $3,725,000 from lease termination related costs associated with underperforming retail
stores and the exit of excess distribution capacity, cost of goods sold as a percentage of net revenues decreased to
64.4% in fiscal 2009 from 66.2% in fiscal 2008. This decrease as a percentage of net revenues was driven by a
reduction in the cost of merchandise (including the impact of reduced markdown activity), favorable inventory
shrinkage results and a decrease in replacement and damages expense, partially offset by the deleverage of fixed
occupancy expenses resulting from declining net revenues and the expense from lease termination related costs.
In the retail channel, cost of goods sold as a percentage of retail net revenues decreased 320 basis points during
fiscal 2009 compared to fiscal 2008. This decrease as a percentage of net revenues was primarily driven by a
reduction in cost of merchandise (including the impact of reduced markdown activity), favorable inventory
shrinkage results, partially offset by the deleverage of fixed occupancy expenses resulting from declining net
revenues.
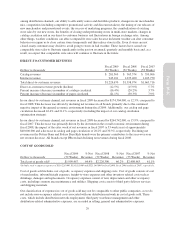
In the direct-to-customer channel, cost of goods sold as a percentage of direct-to-customer net revenues
decreased by 130 basis points during fiscal 2009 compared to fiscal 2008. This decrease as a percentage of net
revenues was driven by a decrease in replacement and damages expense and favorable inventory shrinkage
results, partially offset by an increase in cost of merchandise (including the impact of greater markdown activity)
and the deleverage of fixed occupancy expenses resulting from declining net revenues.
Fiscal 2008 vs. Fiscal 2007
Cost of goods sold decreased by $182,663,000, or 7.6%, in fiscal 2008 compared to fiscal 2007. Including
expense of approximately $2,390,000 from lease termination related costs associated with our infrastructure cost
reduction program, cost of goods sold as a percentage of net revenues increased to 66.2% in fiscal 2008 from
61.1% in fiscal 2007. This increase as a percentage of net revenues was driven by the deleverage of fixed
occupancy expenses primarily due to declining sales, an increase in cost of merchandise (including the impact of
greater markdowns) and an increase in inventory related reserves of approximately $11,172,000 partially offset
by favorable replacement and damages expense.
In the retail channel, cost of goods sold as a percentage of retail net revenues increased 670 basis points during
fiscal 2008 compared to fiscal 2007. This increase as a percentage of net revenues was primarily driven by the
deleverage of fixed occupancy expenses due to declining sales, an increase in cost of merchandise (including the
impact of greater markdowns) and an increase in inventory related reserves, partially offset by favorable
replacement and damages expense.
In the direct-to-customer channel, cost of goods sold as a percentage of direct-to-customer net revenues increased
by 180 basis points during fiscal 2008 compared to fiscal 2007. This increase as a percentage of net revenues was
primarily driven by an increase in cost of merchandise (including the impact of greater markdowns), an increase
in inventory related reserves and the deleverage of fixed occupancy expenses due to declining sales, partially
offset by favorable replacement and damages expense.
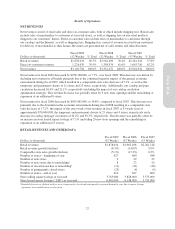
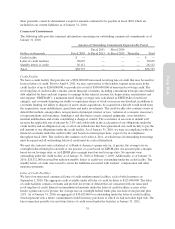
SELLING, GENERAL AND ADMINISTRATIVE EXPENSES
Dollars in thousands
Fiscal 2009
(52 Weeks)
% Net
Revenues
Fiscal 2008
(52 Weeks)
% Net
Revenues
Fiscal 2007
(53 Weeks)
% Net
Revenues
Selling, general and administrative expenses $981,795 31.6% $1,093,019 32.5% $1,222,573 31.0%
Selling, general and administrative expenses consist of non-occupancy related costs associated with our retail
stores, distribution warehouses, customer care centers, supply chain operations (buying, receiving and
30