Pottery Barn 2009 Annual Report Download - page 58
Download and view the complete annual report
Please find page 58 of the 2009 Pottery Barn annual report below. You can navigate through the pages in the report by either clicking on the pages listed below, or by using the keyword search tool below to find specific information within the annual report.-
 1
1 -
2
-
3
-
4
-
5
-
6
-
7
-
8
-
9
-
10
-
11
-
12
-
13
-
14
-
15
-
16
-
17
-
18
-
19
-
20
-
21
-
22
-
23
-
24
-
25
-
26
-
27
-
28
-
29
-
30
-
31
-
32
-
33
-
34
-
35
-
36
-
37
-
38
-
39
-
40
-
41
-
42
-
43
-
44
-
45
-
46
-
47
-
 48
48 -
 49
49 -
 50
50 -
 51
51 -
 52
52 -
 53
53 -
 54
54 -
 55
55 -
 56
56 -
 57
57 -
 58
58 -
 59
59 -
 60
60 -
 61
61 -
 62
62 -
 63
63 -
 64
64 -
 65
65 -
 66
66 -
 67
67 -
 68
68 -
69
-
70
-
71
-
72
-
73
-
74
-
75
-
76
-
77
-
78
-
79
-
80
-
81
-
82
-
83
-
84
-
85
-
86
-
87
-
88
-
89
-
90
-
91
-
92
-
93
-
94
-
95
-
96
-
97
-
98
-
99
-
100
-
101
-
102
-
103
-
104
-
105
-
106
-
107
-
108
-
109
-
110
-
111
-
112
-
113
-
114
-
115
-
116
-
117
-
118
-
119
-
120
-
121
-
122
-
123
-
124
-
125
-
126
-
127
-
128
-
129
-
130
-
131
-
132
-
133
-
134
-
135
-
136
-
137
-
138
-
139
-
140
-
141
-
142
-
143
-
144
-
145
-
146
-
147
-
148
-
149
-
150
-
151
-
152
-
153
-
154
-
155
-
156
-
157
-
158
-
159
-
160
-
161
-
162
-
163
-
164
-
165
-
166
-
167
-
168
-
169
-
170
-
171
-
172
-
173
-
174
-
175
-
176
-
177
-
178
-
179
-
180
-
181
-
182
-
183
-
184
-
185
-
186
-
187
-
188
-
189
-
190
-
191
-
192
-
193
-
194
-
195
-
196
-
197
-
198
-
199
-
200
 |
 |

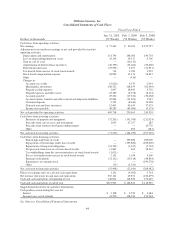
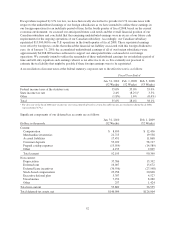
and can vary from our estimates due to such factors as changes in operations within our distribution centers, the
mix of our inventory (which ranges from large furniture to small tabletop items) and execution against loss
prevention initiatives in our stores, distribution centers, off-site storage locations, and with our third party
transportation providers. Accordingly, there is no remaining shrinkage reserve balance at year-end.
Due to these factors, our obsolescence and shrinkage reserves contain uncertainties. Both estimates have
calculations that require management to make assumptions and to apply judgment regarding a number of factors,
including market conditions, the selling environment, historical results and current inventory trends. If actual
obsolescence or shrinkage estimates change from our original estimate, we will adjust our reserves accordingly
throughout the year. Management does not believe that changes in the assumptions used in these estimates would
have a significant effect on our inventory balances. We have made no material changes to our assumptions
included in the calculations of the obsolescence and shrinkage reserves throughout the year. In addition, we do
not believe a 10% change in our inventory reserves would have a material effect on net earnings. As of
January 31, 2010 and February 1, 2009, our inventory obsolescence reserves were $18,565,000 and $20,647,000,
respectively.
Advertising and Prepaid Catalog Expenses
Advertising expenses consist of media and production costs related to catalog mailings, e-commerce advertising
and other direct marketing activities. All advertising costs are expensed as incurred, or upon the release of the
initial advertisement, with the exception of prepaid catalog expenses. Prepaid catalog expenses consist primarily
of third party incremental direct costs, including creative design, paper, printing, postage and mailing costs for all
of our direct response catalogs. Such costs are capitalized as prepaid catalog expenses and are amortized over
their expected period of future benefit. Such amortization is based upon the ratio of actual revenues to the total of
actual and estimated future revenues on an individual catalog basis. Estimated future revenues are based upon
various factors such as the total number of catalogs and pages circulated, the probability and magnitude of
consumer response and the assortment of merchandise offered. Each catalog is generally fully amortized over a
six to nine month period, with the majority of the amortization occurring within the first four to five months.
Prepaid catalog expenses are evaluated for realizability on a monthly basis by comparing the carrying amount
associated with each catalog to the estimated probable remaining future profitability (remaining net revenues less
merchandise cost of goods sold, selling expenses and catalog-related costs) associated with that catalog. If the
catalog is not expected to be profitable, the carrying amount of the catalog is impaired accordingly.
Total advertising expenses (including catalog advertising, e-commerce advertising and all other advertising
costs) were approximately $264,963,000, $328,019,000 and $379,468,000 in fiscal 2009, fiscal 2008 and fiscal
2007, respectively.
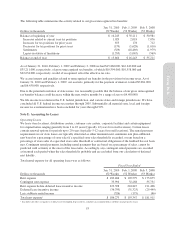
Property and Equipment
Property and equipment is stated at cost. Depreciation is computed using the straight-line method over the
estimated useful lives of the assets below.
Leasehold improvements Shorter of estimated useful life or lease term (generally 2 – 22 years)
Fixtures and equipment 2 – 20 years
Buildings and building improvements 5 – 40 years
Capitalized software 2 – 10 years
Corporate aircraft 20 years (20% salvage value)
Interest costs related to assets under construction, including software projects, are capitalized during the
construction or development period. We capitalized interest costs of $1,763,000, $1,163,000 and $1,389,000 in
fiscal 2009, fiscal 2008 and fiscal 2007, respectively.
We review the carrying value of all long-lived assets for impairment, primarily at a store level, whenever events
or changes in circumstances indicate that the carrying value of an asset may not be recoverable. We review for
impairment all stores for which current or projected cash flows from operations are not sufficient to recover the
carrying value of the assets. Impairment results when the carrying value of the assets exceeds the undiscounted
46