Motorola 2004 Annual Report Download - page 96
Download and view the complete annual report
Please find page 96 of the 2004 Motorola annual report below. You can navigate through the pages in the report by either clicking on the pages listed below, or by using the keyword search tool below to find specific information within the annual report.-
 1
1 -
2
-
3
-
4
-
5
-
6
-
7
-
8
-
9
-
10
-
11
-
12
-
13
-
14
-
15
-
16
-
17
-
18
-
19
-
20
-
21
-
22
-
23
-
24
-
25
-
26
-
27
-
28
-
29
-
30
-
31
-
32
-
33
-
34
-
35
-
36
-
37
-
38
-
39
-
40
-
41
-
42
-
43
-
44
-
45
-
46
-
47
-
48
-
49
-
50
-
51
-
52
-
53
-
54
-
55
-
56
-
57
-
58
-
59
-
60
-
61
-
62
-
63
-
64
-
65
-
66
-
67
-
68
-
69
-
70
-
71
-
72
-
73
-
74
-
75
-
76
-
77
-
78
-
79
-
80
-
81
-
82
-
83
-
84
-
85
-
 86
86 -
 87
87 -
 88
88 -
 89
89 -
 90
90 -
 91
91 -
 92
92 -
 93
93 -
 94
94 -
 95
95 -
 96
96 -
 97
97 -
 98
98 -
 99
99 -
 100
100 -
 101
101 -
 102
102 -
 103
103 -
 104
104 -
 105
105 -
 106
106 -
107
-
108
-
109
-
110
-
111
-
112
-
113
-
114
-
115
-
116
-
117
-
118
-
119
-
120
-
121
-
122
-
123
-
124
-
125
-
126
-
127
-
128
-
129
-
130
-
131
-
132
-
133
-
134
-
135
-
136
-
137
-
138
-
139
-
140
-
141
-
142
-
143
-
144
-
145
-
146
-
147
-
148
 |
 |

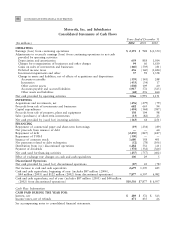
88 CONSOLIDATED FINANCIAL STATEMENTS
Motorola, Inc. and Subsidiaries
Consolidated Statements of Cash Flows
Years Ended December 31
(In millions)
2004
2003 2002
OPERATING
Earnings (loss) from continuing operations $ 2,191 $ 928 $(1,350)
Adjustments to reconcile earnings (loss) from continuing operations to net cash
provided by operating activities:
Depreciation and amortization 659 818 1,014
Charges for reorganization of businesses and other charges 94 66 1,610
Gains on sales of investments and businesses (460) (539) (81)
Deferred income taxes 456 (160) (1,424)
Investment impairments and other 57 92 1,358
Change in assets and liabilities, net of eÅects of acquisitions and dispositions:
Accounts receivable (539) (141) 248
Inventories (433) (34) 17
Other current assets (808) 109 60
Accounts payable and accrued liabilities 1,917 576 (565)
Other assets and liabilities (68) 276 264
Net cash provided by operating activities 3,066 1,991 1,151
INVESTING
Acquisitions and investments, net (476) (279) (79)
Proceeds from sale of investments and businesses 682 665 94
Capital expenditures (494) (344) (387)
Proceeds from sale of property, plant and equipment 138 104 98
Sales (purchases) of short-term investments (13) (82) 23
Net cash provided by (used for) investing activities (163) 64 (251)
FINANCING
Repayment of commercial paper and short-term borrowings (19) (234) (89)
Net proceeds from issuance of debt ÌÌ64
Repayment of debt (2,250) (827) (247)
Repayment of TOPrS (500) ÌÌ
Issuance of common stock 1,680 158 401
Net payments related to debt redemption (52) (78) (106)
Distribution from (to) discontinued operations 1,282 556 (61)
Payment of dividends (378) (332) (364)
Net cash used for Ñnancing activities (237) (757) (402)
EÅect of exchange rate changes on cash and cash equivalents 100 29 5
Discontinued Operations
Net cash provided by (used for) discontinued operations (87) 43 (78)
Net increase in cash and cash equivalents 2,679 1,370 425
Cash and cash equivalents, beginning of year (includes $87 million (2004),
$44 million (2003) and $122 million (2002) from discontinued operations) 7,877 6,507 6,082
Cash and cash equivalents, end of year (includes $87 million (2003) and $44 million
(2002) from discontinued operations) $10,556 $7,877 $ 6,507
Cash Flow Information
CASH PAID DURING THE YEAR FOR:
Interest, net $ 289 $ 376 $ 563
Income taxes, net of refunds 471 435 66
See accompanying notes to consolidated Ñnancial statements.