Motorola 2004 Annual Report Download - page 44
Download and view the complete annual report
Please find page 44 of the 2004 Motorola annual report below. You can navigate through the pages in the report by either clicking on the pages listed below, or by using the keyword search tool below to find specific information within the annual report.-
 1
1 -
2
-
3
-
4
-
5
-
6
-
7
-
8
-
9
-
10
-
11
-
12
-
13
-
14
-
15
-
16
-
17
-
18
-
19
-
20
-
21
-
22
-
23
-
24
-
25
-
26
-
27
-
28
-
29
-
30
-
31
-
32
-
33
-
 34
34 -
 35
35 -
 36
36 -
 37
37 -
 38
38 -
 39
39 -
 40
40 -
 41
41 -
 42
42 -
 43
43 -
 44
44 -
 45
45 -
 46
46 -
 47
47 -
 48
48 -
 49
49 -
 50
50 -
 51
51 -
 52
52 -
 53
53 -
 54
54 -
55
-
56
-
57
-
58
-
59
-
60
-
61
-
62
-
63
-
64
-
65
-
66
-
67
-
68
-
69
-
70
-
71
-
72
-
73
-
74
-
75
-
76
-
77
-
78
-
79
-
80
-
81
-
82
-
83
-
84
-
85
-
86
-
87
-
88
-
89
-
90
-
91
-
92
-
93
-
94
-
95
-
96
-
97
-
98
-
99
-
100
-
101
-
102
-
103
-
104
-
105
-
106
-
107
-
108
-
109
-
110
-
111
-
112
-
113
-
114
-
115
-
116
-
117
-
118
-
119
-
120
-
121
-
122
-
123
-
124
-
125
-
126
-
127
-
128
-
129
-
130
-
131
-
132
-
133
-
134
-
135
-
136
-
137
-
138
-
139
-
140
-
141
-
142
-
143
-
144
-
145
-
146
-
147
-
148
 |
 |

36 MANAGEMENT'S DISCUSSION AND ANALYSIS
OF FINANCIAL CONDITION AND RESULTS OF OPERATIONS
technologies and regions, (iii) a $478 million increase in net sales by the Broadband Communications segment
(""BCS''), primarily due to increased purchases of digital cable set-top boxes by cable operators and an increase in
ASP for digital set-top boxes due to a mix shift towards higher-end products, (iv) a $457 million increase in net
sales by the Commercial, Government and Industrial Solutions segment (""CGISS''), reÖecting increased spending by
customers in both the segment's government market, in response to global homeland security initiatives, and in the
segment's enterprise market, for business-critical communications needs, and reÖects increased net sales in all
regions, and (v) a $431 million increase in the Integrated Electronic Systems segment (""IESS''), primarily due to
increased net sales in the automotive electronics market, particularly telematics products, and additional net sales
from the addition of Force Computers, which was acquired in August 2004.
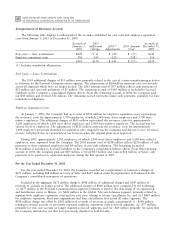
Gross Margin
Gross margin was $10.5 billion, or 33.5% of net sales, in 2004, compared to $7.6 billion, or 32.7% of net sales,
in 2003. Three of the Ñve major segments had a higher gross margin as a percentage of net sales, including:
(i) PCS, primarily due to the increase in net sales and cost savings from ongoing cost-reduction activities and
improvements in the supply-chain, (ii) GTSS, primarily due to the increase in net sales and cost savings from
improvements in the supply-chain, and (iii) CGISS, primarily due to the increase in net sales, cost savings from
supply chain eÇciencies and overall cost structure improvements. These improvements in gross margin percentage
were partially oÅset by a decrease in gross margin as a percentage of net sales in BCS, primarily due to higher sales
of new, higher-tier products carrying lower initial margins.
Selling, General and Administrative Expenses
Selling, general and administrative (""SG&A'') expenditures increased 19% to $4.2 billion, or 13.4% of net
sales, in 2004, compared to $3.5 billion, or 15.2% of net sales, in 2003. Four of the Company's Ñve major segments
had increased SG&A expenditures in 2004 compared to 2003, although SG&A expenditures as percentage of net
sales decreased in four of the Ñve major segments. The increase in SG&A expenditures in 2004 compared to 2003
was driven by increased general and selling expenditures, partially oÅset by a decrease in administrative
expenditures. General expenditures increased in all Ñve major segments, primarily due to an increase in employee
incentive program accruals. The increase in selling expenditures was due to: (i) increased advertising and
promotional expenditures in PCS to support higher sales and promote brand awareness, (ii) increased selling and
sales support expenditures, which increased in four of the Ñve major segments, driven by the increase in sales
commissions resulting from the increase in net sales, and (iii) increased marketing expenditures in all Ñve of the
major segments.
Research and Development Expenditures
Research and development (""R&D'') expenditures increased 9% to $3.1 billion, or 9.8% of net sales, in 2004,
compared to $2.8 billion, or 12.1% of net sales, in 2003. Four of the Company's Ñve major segments had increased
R&D expenditures in 2004 compared to 2003, although R&D expenditures as percentage of net sales decreased in
four of the Ñve major segments. The increase in R&D expenditures was primarily due to increased expenditures by:
(i) PCS, reÖecting an increase in developmental engineering expenditures due to additional investment in new
product development, (ii) CGISS, driven by increased investment in new technologies, (iii) the Other Products
segment, due to increased spending on developmental businesses and R&D projects, and (iv) IESS, primarily to
support business wins across the segment and due to increased expenditures from the addition of Force Computers.
Reorganization of Businesses
In 2004, the Company recorded net reversals of $12 million for reserves no longer needed, including
$15 million of reversals in the consolidated statements of operations under Reorganization of Businesses and
$3 million of charges in Costs of Sales. The 2004 net reversals of $12 million included $59 million of charges for
employee separation costs, $66 million of reversals for employee separation and exit cost reserves no longer needed,
and income of $5 million related to Ñxed asset adjustments. The $66 million of reversals constitute 2% of the
Company's $3.3 billion in earnings from continuing operations before income taxes in 2004.
Net reorganization of businesses charges in 2003 were $39 million, including $23 million reÖected in the
consolidated statements of operations under Reorganization of Businesses and $16 million included in Costs of
Sales. The 2003 net charges of $39 million included $174 million of charges for employee separation and exit costs,