Motorola 2004 Annual Report Download - page 71
Download and view the complete annual report
Please find page 71 of the 2004 Motorola annual report below. You can navigate through the pages in the report by either clicking on the pages listed below, or by using the keyword search tool below to find specific information within the annual report.-
 1
1 -
2
-
3
-
4
-
5
-
6
-
7
-
8
-
9
-
10
-
11
-
12
-
13
-
14
-
15
-
16
-
17
-
18
-
19
-
20
-
21
-
22
-
23
-
24
-
25
-
26
-
27
-
28
-
29
-
30
-
31
-
32
-
33
-
34
-
35
-
36
-
37
-
38
-
39
-
40
-
41
-
42
-
43
-
44
-
45
-
46
-
47
-
48
-
49
-
50
-
51
-
52
-
53
-
54
-
55
-
56
-
57
-
58
-
59
-
60
-
 61
61 -
 62
62 -
 63
63 -
 64
64 -
 65
65 -
 66
66 -
 67
67 -
 68
68 -
 69
69 -
 70
70 -
 71
71 -
 72
72 -
 73
73 -
 74
74 -
 75
75 -
 76
76 -
 77
77 -
 78
78 -
 79
79 -
 80
80 -
 81
81 -
82
-
83
-
84
-
85
-
86
-
87
-
88
-
89
-
90
-
91
-
92
-
93
-
94
-
95
-
96
-
97
-
98
-
99
-
100
-
101
-
102
-
103
-
104
-
105
-
106
-
107
-
108
-
109
-
110
-
111
-
112
-
113
-
114
-
115
-
116
-
117
-
118
-
119
-
120
-
121
-
122
-
123
-
124
-
125
-
126
-
127
-
128
-
129
-
130
-
131
-
132
-
133
-
134
-
135
-
136
-
137
-
138
-
139
-
140
-
141
-
142
-
143
-
144
-
145
-
146
-
147
-
148
 |
 |

63
MANAGEMENT'S DISCUSSION AND ANALYSIS
OF FINANCIAL CONDITION AND RESULTS OF OPERATIONS
The segment is dependent upon a small number of customers for a signiÑcant portion of its sales. Because of
continuing consolidation within the cable industry, a small number of large cable television multiple system
operators (""MSOs'') own a large portion of the cable systems and account for a signiÑcant portion of the total
capital spending. In 2004, net sales to the segment's top Ñve customers represented 47% of the segment's total net
sales. Net sales to the segment's largest customer, Comcast, accounted for 30% of the total net sales of the
segment. The loss of business from any major MSO could have a signiÑcant impact on the segment's business.
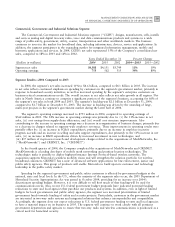
The segment generated operating earnings of $116 million in 2004, compared to an operating loss of
$38 million in 2003. The improvement in operating results was due to: (i) an increase in gross margin, which was
due to the 26% increase in net sales, (ii) a $73 million charge for impairment of goodwill related to the
infrastructure business that occurred in 2003, and (iii) a decrease in SG&A expenditures. The decrease in SG&A
expenditures was primarily due to: (i) a decrease in intangible amortization, and (ii) a decrease in administrative
expenses due to beneÑts from prior cost-reduction actions, partially oÅset by an increase in employee incentive
program accruals. These improvements in operating results were partially oÅset by a $15 million charge for in-
process research and development related to the acquisition of Quantum Bridge in May 2004. Although gross
margin increased, the segment's gross margin as a percentage of net sales decreased, primarily due to sales of new
higher-tier products carrying lower initial margins, which is typical of the early phases of the segment's product life
cycles.
In May 2004, the Company completed the acquisition of Quantum Bridge, a leading provider of FTTP
solutions. The acquisition complements Motorola's existing multiservice technology, enabling the Company to oÅer
a full-service access platform that broadband network operators can deploy to deliver the next generation of
advanced services. Motorola plans to integrate Quantum Bridge's Ñeld-proven passive optical networking and
carrier-class switching technology into its suite of network infrastructure solutions, enhancing the Company's
market position in the end-to-end delivery of broadband products.
Segment ResultsÌ2003 Compared to 2002
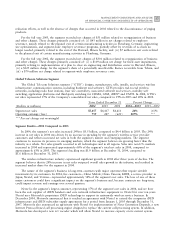
In 2003, the segment's net sales declined 13% to $1.9 billion, compared to $2.1 billion in 2002. The segment's
backlog was $299 million at December 31, 2003, compared to $324 million at December 31, 2002. In 2003, the
segment's customers signiÑcantly reduced their capital spending for the second consecutive year, primarily in an
eÅort to reduce cost structures and improve their cash Öow. This was reÖected in lower purchases of digital set-top
terminals, as well as a reduction in purchases of network transmission systems and equipment. The decrease in the
segment's net sales was driven by this reduction in spending by the segment's customers. The industry also
experienced a reduction in ASP for cable modems.
On a geographic basis, $1.5 billion, or 84%, of the segment's net sales were in North America in 2003,
compared to $1.8 billion, or 85%, in 2002. Of the $286 million decline in net sales in 2003, the majority was in
North America. The decline in North America, and other regions, was driven by the decline in sales of digital set-
top box units.
In 2003, net sales of digital set-top boxes decreased 30% compared to 2002. The decrease in net sales was due
to a decrease in unit shipments and ASP. The decline in unit shipments and ASP are consistent with the overall
decline in the set-top box industry, and the segment retained its leading market share in North America.
In 2003, net sales of cable modems increased 3% compared to 2002. The increase in net sales was driven by an
increase in unit shipments, which were partially oÅset by a decrease in ASP. The decrease in ASP for cable modems
was primarily due to increased competition in low-end cable modems. The segment retained its leading worldwide
market share in cable modems.
In 2003, the segment was dependent upon a small number of customers for a signiÑcant portion of its sales. A
small number of large cable television multiple system operators own a large portion of the cable systems and
account for a signiÑcant portion of the total capital spending in the cable equipment industry. Net sales to the
segment's largest customer, Comcast, accounted for 40% of consolidated net sales of the segment in 2003.
The segment reported an operating loss of $38 million in 2003, compared to an operating loss of $216 million
in 2002. The improvement in operating results was primarily related to a decrease in reorganization of businesses
and other charges, partially oÅset by a decrease in gross margin, reÖecting the 13% decline in net sales.