Motorola 2004 Annual Report Download - page 46
Download and view the complete annual report
Please find page 46 of the 2004 Motorola annual report below. You can navigate through the pages in the report by either clicking on the pages listed below, or by using the keyword search tool below to find specific information within the annual report.-
 1
1 -
2
-
3
-
4
-
5
-
6
-
7
-
8
-
9
-
10
-
11
-
12
-
13
-
14
-
15
-
16
-
17
-
18
-
19
-
20
-
21
-
22
-
23
-
24
-
25
-
26
-
27
-
28
-
29
-
30
-
31
-
32
-
33
-
34
-
35
-
 36
36 -
 37
37 -
 38
38 -
 39
39 -
 40
40 -
 41
41 -
 42
42 -
 43
43 -
 44
44 -
 45
45 -
 46
46 -
 47
47 -
 48
48 -
 49
49 -
 50
50 -
 51
51 -
 52
52 -
 53
53 -
 54
54 -
 55
55 -
 56
56 -
57
-
58
-
59
-
60
-
61
-
62
-
63
-
64
-
65
-
66
-
67
-
68
-
69
-
70
-
71
-
72
-
73
-
74
-
75
-
76
-
77
-
78
-
79
-
80
-
81
-
82
-
83
-
84
-
85
-
86
-
87
-
88
-
89
-
90
-
91
-
92
-
93
-
94
-
95
-
96
-
97
-
98
-
99
-
100
-
101
-
102
-
103
-
104
-
105
-
106
-
107
-
108
-
109
-
110
-
111
-
112
-
113
-
114
-
115
-
116
-
117
-
118
-
119
-
120
-
121
-
122
-
123
-
124
-
125
-
126
-
127
-
128
-
129
-
130
-
131
-
132
-
133
-
134
-
135
-
136
-
137
-
138
-
139
-
140
-
141
-
142
-
143
-
144
-
145
-
146
-
147
-
148
 |
 |

38 MANAGEMENT'S DISCUSSION AND ANALYSIS
OF FINANCIAL CONDITION AND RESULTS OF OPERATIONS
operator, and (ii) foreign currency losses of $73 million, partially oÅset by $30 million of equity in net earnings of
aÇliated companies.
EÅective Tax Rate
The eÅective tax rate was 33% in both 2004 and 2003, representing tax expense of $1.1 billion and
$448 million, in 2004 and 2003, respectively. The 2004 eÅective tax rate reÖects a $241 million beneÑt from the
reversal of previously-accrued income taxes as a result of settlements reached with taxing authorities and a
reassessment of tax exposures based on the status of current audits. The 2004 eÅective tax rate also reÖects
nondeductible charges of $125 million for the impairment of goodwill related to a sensor business and $31 million
for IPR&D charges related to acquisitions.
The 2003 eÅective tax rate reÖected a $61 million beneÑt from the reversal of previously-accrued income taxes
as a result of settlements reached with taxing authorities and $32 million for IPR&D charges related to acquisitions
in 2003.
Earnings from Continuing Operations
The Company had earnings from continuing operations before income taxes of $3.3 billion in 2004, compared
to earnings from continuing operations before income taxes of $1.4 billion in 2003. After taxes, the Company had
earnings from continuing operations of $2.2 billion, or $0.90 per diluted share from continuing operations, in 2004,
compared to earnings from continuing operations of $928 million, or $0.39 per diluted share from continuing
operations, in 2003.
The $1.9 billion increase in earnings from continuing operations before income taxes is primarily attributed to:
(i) a $2.9 billion increase in gross margin, primarily due to the $8.2 billion increase in total net sales, as well as
cost savings from improved supply-chain execution, overall cost structure improvements and ongoing cost reduction
activities, (ii) a $95 million decrease in net interest expense, driven primarily by the reduction in total debt in 2004,
(iii) a $51 million decrease in overall reorganization of businesses charges, including a $13 million decrease in
reorganization of businesses costs recognized in Costs of Sales and a $38 million decrease in costs recognized in
Reorganization of Businesses. These improvements in earnings were partially oÅset by: (i) a $680 million increase
in SG&A expenditures, primarily driven by increases in: (a) employee incentive program accruals, (b) sales
commissions resulting from the increase in net sales, (c) advertising and promotions expenditures in PCS, and
(d) marketing expenditures, (ii) a $261 million increase in R&D expenditures, due primarily to an increase in
developmental engineering expenditures in PCS due to additional investment in new product development, and
increased investment in new technologies by CGISS, (iii) a $168 million increase in Other Charges, primarily due to
a $125 million impairment charge related to goodwill associated with a sensor business and $34 million in IPR&D
charges related to 2004 acquisitions, and (iv) a $79 million decrease in gains on sales of investments and businesses.
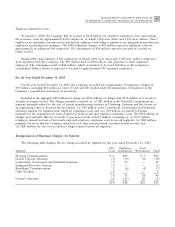
Results of OperationsÌ2003 Compared to 2002
Net Sales
Net sales were $23.2 billion in 2003, down 1% from $23.4 billion in 2002. The overall decline in net sales was
primarily related to: (i) a $286 million decrease in net sales by BCS, reÖecting continued reductions in capital
spending by cable service providers, (ii) a $196 million decrease in net sales by PCS, primarily due to: (a) increased
competition in Asia, (b) an estimated loss in market share during 2003, resulting from delays in the introduction of
new products, driven by supply constraints for a key component, and (c) the discontinued sale of paging products
during 2002, and (iii) a $194 million decrease in net sales by GTSS, reÖecting continued reductions in capital
spending by cellular operators during 2003, speciÑcally in mature markets. These decreases were partially oÅset by:
(i) a $382 million increase in net sales by CGISS, reÖecting increased customer spending due to homeland security
initiatives in the government market, as well as an increase in sales due to the conÖict in the Middle East and the
reconstruction of public safety systems in Iraq, and (ii) a $76 million increase in net sales by IESS, primarily due to
the success of several new products in the automotive market and increased demand from industrial automation,
medical and telecommunications customers.