Motorola 2004 Annual Report Download - page 103
Download and view the complete annual report
Please find page 103 of the 2004 Motorola annual report below. You can navigate through the pages in the report by either clicking on the pages listed below, or by using the keyword search tool below to find specific information within the annual report.-
 1
1 -
2
-
3
-
4
-
5
-
6
-
7
-
8
-
9
-
10
-
11
-
12
-
13
-
14
-
15
-
16
-
17
-
18
-
19
-
20
-
21
-
22
-
23
-
24
-
25
-
26
-
27
-
28
-
29
-
30
-
31
-
32
-
33
-
34
-
35
-
36
-
37
-
38
-
39
-
40
-
41
-
42
-
43
-
44
-
45
-
46
-
47
-
48
-
49
-
50
-
51
-
52
-
53
-
54
-
55
-
56
-
57
-
58
-
59
-
60
-
61
-
62
-
63
-
64
-
65
-
66
-
67
-
68
-
69
-
70
-
71
-
72
-
73
-
74
-
75
-
76
-
77
-
78
-
79
-
80
-
81
-
82
-
83
-
84
-
85
-
86
-
87
-
88
-
89
-
90
-
91
-
92
-
 93
93 -
 94
94 -
 95
95 -
 96
96 -
 97
97 -
 98
98 -
 99
99 -
 100
100 -
 101
101 -
 102
102 -
 103
103 -
 104
104 -
 105
105 -
 106
106 -
 107
107 -
 108
108 -
 109
109 -
 110
110 -
 111
111 -
 112
112 -
 113
113 -
114
-
115
-
116
-
117
-
118
-
119
-
120
-
121
-
122
-
123
-
124
-
125
-
126
-
127
-
128
-
129
-
130
-
131
-
132
-
133
-
134
-
135
-
136
-
137
-
138
-
139
-
140
-
141
-
142
-
143
-
144
-
145
-
146
-
147
-
148
 |
 |

95
MOTOROLA INC. AND SUBSIDIARIES NOTES TO
CONSOLIDATED FINANCIAL STATEMENTS(Dollars in millions, except as noted)
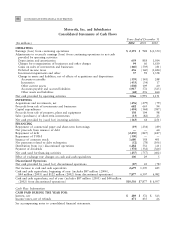
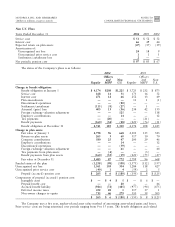
Property, Plant, and Equipment
Property, Plant and Equipment, net, consists of the following:
December 31
2004
2003
Land $ 200 $ 212
Building 1,959 2,061
Machinery and equipment 6,222 6,189
8,381 8,462
Less accumulated depreciation (6,049) (5,989)
Property, plant and equipment, net $ 2,332 $ 2,473
Depreciation expense for the years ended December 31, 2004, 2003 and 2002 was $561 million, $663 million
and $903 million, respectively.
Investments
Investments consist of the following:
December 31
2004
2003
Available-for-sale securities:
Cost basis $ 616 $ 499
Gross unrealized gains 2,296 2,438
Gross unrealized losses (7) (8)
Fair value 2,905 2,929
Other securities, at cost 213 226
Equity method investments 123 147
$3,241 $3,302
The Company recorded investment impairment charges of $36 million, $96 million and $1.2 billion for the
years ended December 31, 2004, 2003 and 2002, respectively. These impairment charges represent other-than-
temporary declines in the value of the Company's investment portfolio. The $96 million of impairment charges in
2003 is primarily comprised of a $29 million charge to write down to zero the Company's debt security holdings in
a European cable operator and other cost-based investment write-downs. The $1.2 billion of impairment charges in
2002, is primarily comprised of: (i) a $464 million writedown in the value of the Company's investment in Nextel
Communications, Inc.; (ii) a $73 million writedown of the Company's investment in Telus Corporation; (iii) a
$321 million writedown of the Company's debt security holdings and associated warrants in Callahan Associates
International L.L.C.; and (iv) a $95 million charge to write the value of the Company's investment in an Argentine
cellular operating company to zero. Investment impairment charges are included in Other within Other Income
(Expense) in the Company's consolidated statements of operations.
Gains on sales of investments and businesses, consists of the following:
Years Ended December 31
2004
2003 2002
Gains on sales of investments $434 $524 $27
Gains on sales of businesses 26 15 54
$460 $539 $81
For the year ended December 31, 2004, the $460 million gain on sales of investments and businesses is
primarily comprised of: (i) a $130 million gain on the sale of the Company's remaining shares in Broadcom
Corporation, (ii) a $122 million gain on the sale of a portion of the Company's shares in Nextel Communications,
Inc., (iii) an $82 million gain on the sale of a portion of the Company's shares in Telus Corporation, and (iv) a
$68 million gain on the sale of a portion of the Company's shares in Nextel Partners, Inc.
For the year ended December 31, 2003, the $539 million gain on sales of investments and businesses is
primarily comprised of: (i) a $255 million gain on the sale of a portion of common stock in Nextel
Communications, Inc., (ii) an $80 million gain on the sale of the Company's shares in Symbian Limited, (iii) a