Motorola 2004 Annual Report Download - page 43
Download and view the complete annual report
Please find page 43 of the 2004 Motorola annual report below. You can navigate through the pages in the report by either clicking on the pages listed below, or by using the keyword search tool below to find specific information within the annual report.-
 1
1 -
2
-
3
-
4
-
5
-
6
-
7
-
8
-
9
-
10
-
11
-
12
-
13
-
14
-
15
-
16
-
17
-
18
-
19
-
20
-
21
-
22
-
23
-
24
-
25
-
26
-
27
-
28
-
29
-
30
-
31
-
32
-
 33
33 -
 34
34 -
 35
35 -
 36
36 -
 37
37 -
 38
38 -
 39
39 -
 40
40 -
 41
41 -
 42
42 -
 43
43 -
 44
44 -
 45
45 -
 46
46 -
 47
47 -
 48
48 -
 49
49 -
 50
50 -
 51
51 -
 52
52 -
 53
53 -
54
-
55
-
56
-
57
-
58
-
59
-
60
-
61
-
62
-
63
-
64
-
65
-
66
-
67
-
68
-
69
-
70
-
71
-
72
-
73
-
74
-
75
-
76
-
77
-
78
-
79
-
80
-
81
-
82
-
83
-
84
-
85
-
86
-
87
-
88
-
89
-
90
-
91
-
92
-
93
-
94
-
95
-
96
-
97
-
98
-
99
-
100
-
101
-
102
-
103
-
104
-
105
-
106
-
107
-
108
-
109
-
110
-
111
-
112
-
113
-
114
-
115
-
116
-
117
-
118
-
119
-
120
-
121
-
122
-
123
-
124
-
125
-
126
-
127
-
128
-
129
-
130
-
131
-
132
-
133
-
134
-
135
-
136
-
137
-
138
-
139
-
140
-
141
-
142
-
143
-
144
-
145
-
146
-
147
-
148
 |
 |

35
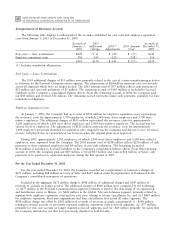
MANAGEMENT'S DISCUSSION AND ANALYSIS
OF FINANCIAL CONDITION AND RESULTS OF OPERATIONS
Results of Operations
Years Ended December 31
(Dollars in millions, except per share
amounts)
2004 % of sales
2003 % of sales 2002 % of sales
Net sales $31,323 $23,155 $23,422
Costs of sales 20,826 66.5% 15,588 67.3% 15,741 67.2%
Gross margin 10,497 33.5% 7,567 32.7% 7,681 32.8%
Selling, general and administrative expenses 4,209 13.4% 3,529 15.2% 3,991 17.0%
Research and development expenditures 3,060 9.8% 2,799 12.1% 2,774 11.9%
Reorganization of businesses (15) (0.1)% 23 0.1% 605 2.6%
Other charges(income) 111 0.4% (57) (0.2)% 754 3.2%
Operating earnings(loss) 3,132 10.0% 1,273 5.5% (443) (1.9)%
Other income(expense):
Interest expense, net (199) (0.6)% (294) (1.3)% (355) (1.5)%
Gains on sales of investments and businesses,
net 460 1.5% 539 2.3% 81 0.4%
Other (141) (0.5)% (142) (0.6)% (1,354) (5.8)%
Earnings(loss) from continuing operations
before income taxes 3,252 10.4% 1,376 5.9% (2,071) (8.8)%
Income tax expense(beneÑt) 1,061 3.4% 448 1.9% (721) (3.1)%
Earnings(loss) from continuing operations 2,191 7.0% 928 4.0% (1,350) (5.7)%
Loss from discontinued operations, net of tax (659) (2.1)% (35) (0.0)% (1,135) (4.9)%
Net earnings(loss) $ 1,532 4.9% $ 893 4.0% $(2,485) (10.6)%
Earnings(loss) per diluted common share:
Continuing operations $ 0.90 $ 0.39 $ (0.59)
Discontinued operations (0.26) (0.01) (0.50)
$ 0.64 $ 0.38 $ (1.09)
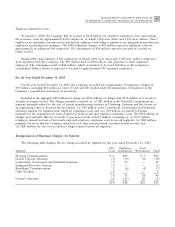
Geographic market sales measured by the locale of the end customer as a percent of total net sales for 2004,
2003 and 2002 are as follows:
Geographic Market Sales by Locale of End Customer
2004
2003 2002
United States 47% 54% 51%
Europe 19% 13% 12%
China 9% 9% 14%
Latin America 9% 8% 6%
Asia, excluding China and Japan 7% 7% 9%
Japan 3% 2% 2%
Other Markets 6% 7% 6%
100% 100% 100%
Results of OperationsÌ2004 Compared to 2003
Net Sales
Net sales were $31.3 billion in 2004, up 35% from $23.2 billion in 2003. Net sales increased in all Ñve of the
Company's major segments in 2004 compared to 2003. The overall increase in net sales was primarily related to:
(i) a $5.8 billion increase in net sales by the Personal Communications segment (""PCS''), driven by a 39% increase
in unit shipments and a 15% increase in average selling price (""ASP''), reÖecting strong consumer demand for new
products, (ii) a $1.0 billion increase in net sales by the Global Telecom Solutions segment (""GTSS''), driven by a
continued increase in spending by the segment's wireless service provider customers and reÖecting sales growth in all