Motorola 2004 Annual Report Download - page 123
Download and view the complete annual report
Please find page 123 of the 2004 Motorola annual report below. You can navigate through the pages in the report by either clicking on the pages listed below, or by using the keyword search tool below to find specific information within the annual report.-
 1
1 -
2
-
3
-
4
-
5
-
6
-
7
-
8
-
9
-
10
-
11
-
12
-
13
-
14
-
15
-
16
-
17
-
18
-
19
-
20
-
21
-
22
-
23
-
24
-
25
-
26
-
27
-
28
-
29
-
30
-
31
-
32
-
33
-
34
-
35
-
36
-
37
-
38
-
39
-
40
-
41
-
42
-
43
-
44
-
45
-
46
-
47
-
48
-
49
-
50
-
51
-
52
-
53
-
54
-
55
-
56
-
57
-
58
-
59
-
60
-
61
-
62
-
63
-
64
-
65
-
66
-
67
-
68
-
69
-
70
-
71
-
72
-
73
-
74
-
75
-
76
-
77
-
78
-
79
-
80
-
81
-
82
-
83
-
84
-
85
-
86
-
87
-
88
-
89
-
90
-
91
-
92
-
93
-
94
-
95
-
96
-
97
-
98
-
99
-
100
-
101
-
102
-
103
-
104
-
105
-
106
-
107
-
108
-
109
-
110
-
111
-
112
-
 113
113 -
 114
114 -
 115
115 -
 116
116 -
 117
117 -
 118
118 -
 119
119 -
 120
120 -
 121
121 -
 122
122 -
 123
123 -
 124
124 -
 125
125 -
 126
126 -
 127
127 -
 128
128 -
 129
129 -
 130
130 -
 131
131 -
 132
132 -
 133
133 -
134
-
135
-
136
-
137
-
138
-
139
-
140
-
141
-
142
-
143
-
144
-
145
-
146
-
147
-
148
 |
 |

115
MOTOROLA INC. AND SUBSIDIARIES NOTES TO
CONSOLIDATED FINANCIAL STATEMENTS(Dollars in millions, except as noted)
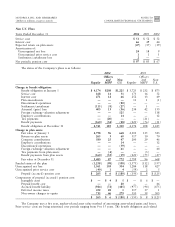
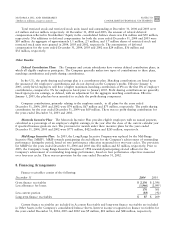
Segment information
Net Sales Operating Earnings (Loss)
Years Ended December 31
2004
2003 2002
2004
2003 2002
Personal Communications Segment $16,823 $10,978 $11,174 $1,708 $ 479 $ 503
Global Telecom Solutions Segment 5,457 4,417 4,611 759 247 (621)
Commercial, Government and Industrial Solutions
Segment 4,588 4,131 3,749 753 562 313
Integrated Electronic Systems Segment 2,696 2,265 2,189 142 161 52
Broadband Communications Segment 2,335 1,857 2,143 116 (38) (216)
Other Products Segment 387 323 430 (229) (44) (214)
Adjustments and Eliminations (963) (816) (874) 47 313
$31,323 $23,155 $23,422 3,296 1,370 (170)
General Corporate (164) (97) (273)
Operating earnings (loss) 3,132 1,273 (443)
Total other income (expense) 120 103 (1,628)
Earnings (loss) from continuing operations before
income taxes $3,252 $1,376 $(2,071)
General Corporate Operating Earnings (Loss) consists of expenses which are not identiÑable with segment
activity. Such items primarily consist of legal expenses, restructuring costs related to corporate employees and
facilities, Iridium-related costs (recoveries), and corporate costs that were not allocated to Freescale Semiconductor
in accordance with the discontinued operations presentation.
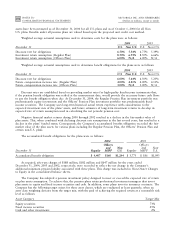
Assets Capital Expenditures Depreciation Expense
Years Ended December 31
2004
2003 2002
2004
2003 2002
2004
2003 2002
Personal Communications Segment $ 5,292 $ 3,783 $ 3,733 $91 $ 74 $101 $128 $159 $203
Global Telecom Solutions Segment 2,616 2,746 3,630 91 67 84 129 155 218
Commercial, Government and Industrial
Solutions Segment 2,215 1,938 1,961 149 76 83 90 96 115
Integrated Electronic Systems Segment 1,368 1,102 1,032 99 44 55 77 74 75
Broadband Communications Segment 2,314 2,354 2,480 27 23 20 59 66 77
Other Products Segment 391 611 444 ÌÌÌ11 921
Adjustments and Eliminations (66) (124) (138) ÌÌÌ2ÌÌ
14,130 12,410 13,142 457 284 343 496 559 709
General Corporate 16,759 14,392 11,902 37 60 44 65 104 194
Discontinued Operations Ì5,244 6,189
$30,889 $32,046 $ 31,233 $494 $344 $387 $561 $663 $903
General corporate assets include primarily cash and cash equivalents, marketable securities, property, plant and
equipment, cost-based investments, deferred income taxes and the administrative headquarters of the Company.
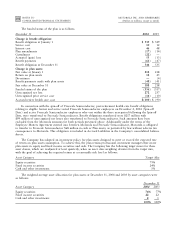
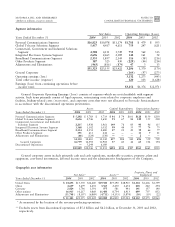
Geographic area information
Property, Plant, and
Net Sales* Assets** Equipment
Years Ended December 31
2004
2003 2002
2004
2003 2002
2004
2003 2002
United States $ 18,693 $15,570 $14,400 $19,580 $19,190 $18,910 $1,304 $1,406 $1,599
China 4,639 3,679 4,431 3,565 2,450 2,654 218 242 294
Germany 2,824 1,796 1,591 975 581 441 141 137 140
Other nations 16,915 10,217 9,869 11,480 8,734 6,913 699 707 852
Adjustments and Eliminations (11,748) (8,107) (6,869) (4,711) (4,153) (3,874) (30) (19) (22)
$ 31,323 $23,155 $23,422 $30,889 $26,802 $25,044 $2,332 $2,473 $2,863
* As measured by the location of the revenue-producing operations.
** Excludes assets from discontinued operations of $5.2 billion and $6.2 billion, at December 31, 2003 and 2002,
respectively.