Motorola 2004 Annual Report Download - page 70
Download and view the complete annual report
Please find page 70 of the 2004 Motorola annual report below. You can navigate through the pages in the report by either clicking on the pages listed below, or by using the keyword search tool below to find specific information within the annual report.
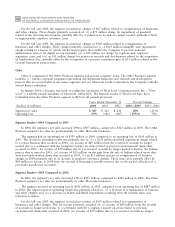
62 MANAGEMENT'S DISCUSSION AND ANALYSIS
OF FINANCIAL CONDITION AND RESULTS OF OPERATIONS
costs of sales. These improvements were partially oÅset by an increase in R&D expenditures, primarily due to a
reduction in customer-funded R&D.
In 2003, the segment recorded net income of $1 million related to reorganization of businesses and other
charges. This income consisted of a net reversal of $1 million in accruals for exit costs that were no longer needed.
In 2002, the segment recorded net charges of $58 million related to reorganization of businesses and other
charges. These charges primarily consisted of: (i) a $24 million net charge for exit costs, (ii) a $23 million net
charge for Ñxed asset impairments, and (iii) a $20 million net charge for segment-wide employee separation costs,
partially oÅset by a reversal of accruals no longer needed.
Broadband Communications Segment
The Broadband Communications segment (""BCS'') designs, manufactures and sells a wide variety of
broadband products, including: (i) digital systems and set-top terminals for cable television and broadcast
networks, (ii) high speed data products, including cable modems and cable modem termination systems, as well as
Internet Protocol-based telephony products, (iii) access network technology, including hybrid Ñber coaxial network
transmission systems and Ñber-to-the-premise (""FTTP'') transmission systems, used by cable television operators,
(iv) digital satellite television systems, (v) direct-to-home satellite networks and private networks for business
communications, and (vi) high-speed data, video and voice broadband systems over existing phone lines. In 2004,
BCS net sales represented 7% of the Company's consolidated net sales, compared to 8% in 2003 and 9% in 2002.
In January 2004, a decision was made to realign the operations of Next Level Communications, Inc. (""Next
Level''), a wholly-owned subsidiary of Motorola, within BCS. The Ñnancial results of Next Level have been
reclassiÑed from the Other Products segment to BCS for all periods presented.
Years Ended December 31 Percent Change
(Dollars in millions)
2004
2003 2002
2004Ì2003
2003Ì2002
Segment net sales $2,335 $1,857 $2,143 26% (13)%
Operating earnings (loss) 116 (38) (216) *** 82%
*** Percent change not meaningful
Segment ResultsÌ2004 Compared to 2003
In 2004, the segment's net sales increased 26% to $2.3 billion, compared to $1.9 billion in 2003. The increase
in overall net sales was primarily due to: (i) increased purchases of digital cable set-top boxes by cable operators,
(ii) an increase in ASP due to a mix shift in digital set-top boxes towards higher-end products, and (iii) an increase
in retail sales. The increase in net sales reÖects net sales growth in all regions, primarily in North America. Net sales
in North America continue to comprise a signiÑcant portion of the segment's business, accounting for 83% of the
segment's total net sales in 2004, compared to 85% in 2003. The segment's backlog was $314 million at
December 31, 2004, compared to $299 million at December 31, 2003.
Demand for the segment's products depends primarily on the level of capital spending by broadband operators
for constructing, rebuilding or upgrading their communications systems and services. In recent prior years, cable
operators have decreased their capital spending, primarily in an eÅort to reduce their overall cost structures and
improve their cash Öow. In 2004, our cable operator customers increased their purchases of the segment's products
and services, primarily due to increased demand for advanced set-tops to provide high-deÑnition/digital video
recording (""HD/DVR'') functionality. In addition to the increased spending by cable operators, retail sales have
increased as consumer demand for high-speed cable access continues to increase.
In 2004, net sales of digital set-top boxes increased 29%, due to increases in both ASP and unit shipments. The
increase in ASP was driven by a product-mix shift towards higher-end products, particularly HD/DVR set-tops. The
increase in unit shipments was primarily due to the increased spending by cable operators. The segment continued
to be the worldwide leader in market share for digital cable set-top boxes.
In 2004, net sales of cable modems increased 20%. The increase in net sales was due to an increase in cable
modem unit shipments, which was partially oÅset by the decline in ASP for cable modems. The decrease in ASP
was primarily due to increased competition. The segment retained its leading worldwide market share in cable
modems.


