Motorola 2004 Annual Report Download - page 125
Download and view the complete annual report
Please find page 125 of the 2004 Motorola annual report below. You can navigate through the pages in the report by either clicking on the pages listed below, or by using the keyword search tool below to find specific information within the annual report.-
 1
1 -
2
-
3
-
4
-
5
-
6
-
7
-
8
-
9
-
10
-
11
-
12
-
13
-
14
-
15
-
16
-
17
-
18
-
19
-
20
-
21
-
22
-
23
-
24
-
25
-
26
-
27
-
28
-
29
-
30
-
31
-
32
-
33
-
34
-
35
-
36
-
37
-
38
-
39
-
40
-
41
-
42
-
43
-
44
-
45
-
46
-
47
-
48
-
49
-
50
-
51
-
52
-
53
-
54
-
55
-
56
-
57
-
58
-
59
-
60
-
61
-
62
-
63
-
64
-
65
-
66
-
67
-
68
-
69
-
70
-
71
-
72
-
73
-
74
-
75
-
76
-
77
-
78
-
79
-
80
-
81
-
82
-
83
-
84
-
85
-
86
-
87
-
88
-
89
-
90
-
91
-
92
-
93
-
94
-
95
-
96
-
97
-
98
-
99
-
100
-
101
-
102
-
103
-
104
-
105
-
106
-
107
-
108
-
109
-
110
-
111
-
112
-
113
-
114
-
 115
115 -
 116
116 -
 117
117 -
 118
118 -
 119
119 -
 120
120 -
 121
121 -
 122
122 -
 123
123 -
 124
124 -
 125
125 -
 126
126 -
 127
127 -
 128
128 -
 129
129 -
 130
130 -
 131
131 -
 132
132 -
 133
133 -
 134
134 -
 135
135 -
136
-
137
-
138
-
139
-
140
-
141
-
142
-
143
-
144
-
145
-
146
-
147
-
148
 |
 |

117
MOTOROLA INC. AND SUBSIDIARIES NOTES TO
CONSOLIDATED FINANCIAL STATEMENTS(Dollars in millions, except as noted)
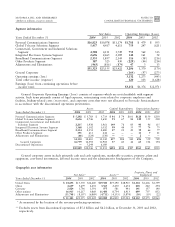
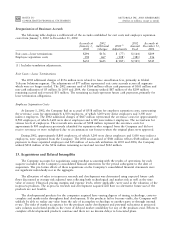
Reorganization of Businesses ChargesÌby Segment
The following table displays the net charges (reversals) for employee separation and exit cost reserve by
segment for the year ended December 31, 2004:
Year Ended
December 31,
Segment 2004
Personal Communications $(27)
Global Telecom Solutions (7)
Commercial, Government and Industrial Solutions 6
Integrated Electronic Systems 10
Broadband Communications (4)
Other Products Ì
(22)
General Corporate 15
$ (7)
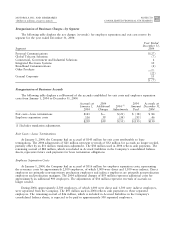
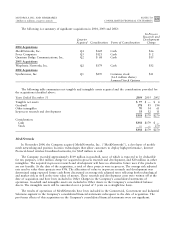
Reorganization of Businesses Accruals
The following table displays a rollforward of the accruals established for exit costs and employee separation
costs from January 1, 2004 to December 31, 2004:
Accruals at 2004 2004 Accruals at
January 1, Additional 2004(1) Amount December 31,
2004 Charges Adjustments Used 2004
Exit costsÌlease terminations $143 $Ì $(21) $ (38) $ 84
Employee separation costs 116 59 (34) (95) 46
$259 $59 $(55) $(133) $130
(1) Includes translation adjustments.
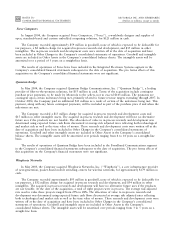
Exit CostsÌLease Terminations
At January 1, 2004, the Company had an accrual of $143 million for exit costs attributable to lease
terminations. The 2004 adjustments of $21 million represent reversals of $32 million for accruals no longer needed,
partially oÅset by an $11 million translation adjustment. The $38 million used in 2004 reÖects cash payments. The
remaining accrual of $84 million, which is included in Accrued Liabilities in the Company's consolidated balance
sheets, represents future cash payments for lease termination obligations.
Employee Separation Costs
At January 1, 2004, the Company had an accrual of $116 million for employee separation costs, representing
the severance costs for approximately 2,100 employees, of which 1,000 were direct and 1,100 were indirect. Direct
employees are primarily non-supervisory production employees and indirect employees are primarily non-production
employees and production managers. The 2004 additional charges of $59 million represent additional costs for
approximately an additional 900 employees. The adjustments of $34 million represent reversals of accruals no
longer needed.
During 2004, approximately 2,500 employees, of which 1,000 were direct and 1,500 were indirect employees,
were separated from the Company. The $95 million used in 2004 reÖects cash payments to these separated
employees. The remaining accrual of $46 million, which is included in Accrued Liabilities in the Company's
consolidated balance sheets, is expected to be paid to approximately 500 separated employees.