Motorola 2004 Annual Report Download - page 47
Download and view the complete annual report
Please find page 47 of the 2004 Motorola annual report below. You can navigate through the pages in the report by either clicking on the pages listed below, or by using the keyword search tool below to find specific information within the annual report.-
 1
1 -
2
-
3
-
4
-
5
-
6
-
7
-
8
-
9
-
10
-
11
-
12
-
13
-
14
-
15
-
16
-
17
-
18
-
19
-
20
-
21
-
22
-
23
-
24
-
25
-
26
-
27
-
28
-
29
-
30
-
31
-
32
-
33
-
34
-
35
-
36
-
 37
37 -
 38
38 -
 39
39 -
 40
40 -
 41
41 -
 42
42 -
 43
43 -
 44
44 -
 45
45 -
 46
46 -
 47
47 -
 48
48 -
 49
49 -
 50
50 -
 51
51 -
 52
52 -
 53
53 -
 54
54 -
 55
55 -
 56
56 -
 57
57 -
58
-
59
-
60
-
61
-
62
-
63
-
64
-
65
-
66
-
67
-
68
-
69
-
70
-
71
-
72
-
73
-
74
-
75
-
76
-
77
-
78
-
79
-
80
-
81
-
82
-
83
-
84
-
85
-
86
-
87
-
88
-
89
-
90
-
91
-
92
-
93
-
94
-
95
-
96
-
97
-
98
-
99
-
100
-
101
-
102
-
103
-
104
-
105
-
106
-
107
-
108
-
109
-
110
-
111
-
112
-
113
-
114
-
115
-
116
-
117
-
118
-
119
-
120
-
121
-
122
-
123
-
124
-
125
-
126
-
127
-
128
-
129
-
130
-
131
-
132
-
133
-
134
-
135
-
136
-
137
-
138
-
139
-
140
-
141
-
142
-
143
-
144
-
145
-
146
-
147
-
148
 |
 |

39
MANAGEMENT'S DISCUSSION AND ANALYSIS
OF FINANCIAL CONDITION AND RESULTS OF OPERATIONS
Gross Margin
Gross margin was $7.6 billion, or 32.7% of net sales, in 2003, compared to $7.7 billion, or 32.8% of net sales,
in 2002. Three of the Company's Ñve major segments had a higher gross margin and higher gross margin as a
percentage of net sales in 2003. The improvement in gross margin as a percentage of net sales reÖects: (i) an
increase in CGISS, primarily from the increase in net sales and a favorable product mix, as well as continued
beneÑts from prior cost-reduction actions, and (ii) an increase in GTSS, primarily due to beneÑts from prior cost-
reduction actions and a decline in reorganization of business charges reÖected in costs of sales, and (iii) an increase
in IESS, primarily from the increase in net sales and a decline in reorganization of business charges reÖected in costs
of sales. These improvements in gross margin percentage were partially oÅset by declines in BCS and PCS, primarily
due to the decline in net sales in these two segments.
The 2003 gross margin included reorganization of business charges of $16 million, which were included in
Costs of Sales and primarily related to direct labor employee severance costs. The 2002 gross margin included
reorganization of business charges of $68 million, which were included in Costs of Sales and primarily related to
direct labor employee severance costs.
Selling, General and Administrative Expenses
SG&A expenses declined 12% to $3.5 billion, or 15.2% of net sales, in 2003, compared to $4.0 billion, or
17.0% of net sales, in 2002. Four of the Company's Ñve major segments had lower SG&A expenses in 2003 than in
2002. The decrease in SG&A expenses was primarily driven by: (i) decreased general and administrative spending
by PCS, reÖecting beneÑts from cost-reduction eÅorts, (ii) decreased selling and sales support costs by GTSS,
reÖecting beneÑts from prior cost-reduction eÅorts, partially oÅset by an increase in employee incentive program
costs, and (iii) decreased general and administrative spending by IESS and BCS, reÖecting beneÑts from prior cost-
reduction actions. These beneÑts were partially oÅset by increased SG&A expenditures in CGISS, primarily due to
an increase in employee incentive program accruals.
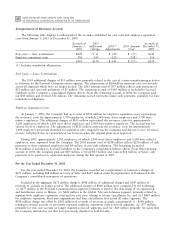
Research and Development Expenditures
R&D expenditures increased slightly to $2.8 billion, or 12.1% of net sales, in 2003, compared to $2.8 billion,
or 11.9% of net sales, in 2002. Four of the Company's Ñve major segments had increased R&D expenditures in
2003. The increase in R&D expenditures was primarily due to increased expenditures by: (i) PCS, reÖecting an
increase in developmental engineering expenditures due to the high volume of new product oÅerings, and (ii) IESS,
reÖecting a reduction in customer funding of R&D. These increased expenditures were partially oÅset by a decrease
in R&D expenditures by GTSS, reÖecting beneÑts from prior restructuring actions.
Reorganization of Businesses
Net reorganization of businesses charges in 2003 were $39 million, including $23 million reÖected in the
consolidated statements of operations under Reorganization of Businesses and $16 million included in Costs of
Sales. The 2003 net charges of $39 million included $174 million of charges for employee separation and exit costs,
$145 million of reversals for employee separation and exit cost reserves no longer needed, $38 million in charges
for the impairment of assets classiÑed as held-for-sale, and $28 million in Ñxed asset adjustments, primarily for
assets which the Company intends to use that were previously classiÑed as held-for-sale.
Net reorganization of businesses charges in 2002 were $673 million, including $605 million reÖected under
Reorganization of Businesses and $68 million included in Costs of Sales. The 2002 net charges of $673 million
included $623 million of charges for employee separation and exit costs, $185 million of reversals for employee
separation and exit cost reserves no longer needed, $306 million in charges for the impairment of assets classiÑed as
held-for-sale, primarily related to the shut-down of an engineering and distribution center in Illinois, and
$71 million in Ñxed asset adjustments, primarily for assets which the Company intends to use that were previously
classiÑed as held-for-sale. These charges are discussed in further detail in the ""Reorganization of Businesses
Programs'' section below.
Other Charges (Income)
The Company recorded net income of $57 million in Other Charges (Income) in 2003, compared to net
charges of $754 million in 2002. The net income of $57 million in 2003 primarily consisted of: (i) $69 million in