MoneyGram 2004 Annual Report Download - page 84
Download and view the complete annual report
Please find page 84 of the 2004 MoneyGram annual report below. You can navigate through the pages in the report by either clicking on the pages listed below, or by using the keyword search tool below to find specific information within the annual report.-
 1
1 -
2
-
3
-
4
-
5
-
6
-
7
-
8
-
9
-
10
-
11
-
12
-
13
-
14
-
15
-
16
-
17
-
18
-
19
-
20
-
21
-
22
-
23
-
24
-
25
-
26
-
27
-
28
-
29
-
30
-
31
-
32
-
33
-
34
-
35
-
36
-
37
-
38
-
39
-
40
-
41
-
42
-
43
-
44
-
45
-
46
-
47
-
48
-
49
-
50
-
51
-
52
-
53
-
54
-
55
-
56
-
57
-
58
-
59
-
60
-
61
-
62
-
63
-
64
-
65
-
66
-
67
-
68
-
69
-
70
-
71
-
72
-
73
-
 74
74 -
 75
75 -
 76
76 -
 77
77 -
 78
78 -
 79
79 -
 80
80 -
 81
81 -
 82
82 -
 83
83 -
 84
84 -
 85
85 -
 86
86 -
 87
87 -
 88
88 -
 89
89 -
 90
90 -
 91
91 -
 92
92 -
 93
93
 |
 |

Table of Contents
MONEYGRAM INTERNATIONAL, INC. AND SUBSIDIARIES
NOTES TO CONSOLIDATED FINANCIAL STATEMENTS — (Continued)
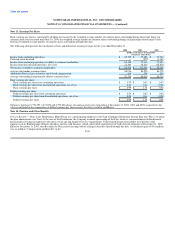
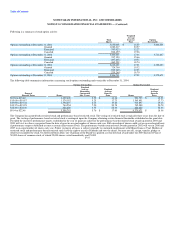
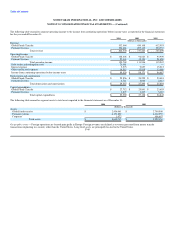
The following table reconciles segment operating income to the income from continuing operations before income taxes as reported in the financial statements
for the year ended December 31:
2004 2003 2002
(Dollars in thousands)
Revenue
Global Funds Transfer: 532,064 450,108 412,953
Payment Systems 294,466 287,115 294,737
Total revenue $ 826,530 $ 737,223 $ 707,690
Operating Income
Global Funds Transfer $ 102,606 $ 96,823 $ 93,909
Payment Systems 27,163 15,123 21,658
Total operating income 129,769 111,946 115,567
Debt tender and redemption costs 20,661 — —
Interest expense 5,573 9,857 15,212
Other unallocated expenses 14,515 13,918 13,668
Income from continuing operations before income taxes $ 89,020 $ 88,171 $ 86,687
Depreciation and amortization
Global Funds Transfer $ 25,856 $ 24,255 $ 23,481
Payment Systems 3,711 3,040 2,413
Total depreciation and amortization $ 29,567 $ 27,295 $ 25,894
Capital expenditures
Global Funds Transfer $ 27,712 $ 25,891 $ 23,655
Payment Systems 1,877 1,237 3,187
Total capital expenditures $ 29,589 $ 27,128 $ 26,842
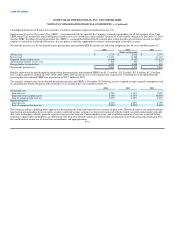
The following table reconciles segment assets to total assets reported in the financial statements as of December 31:
2004 2003
(Dollars in thousands)
Assets
Global funds transfer $ 2,436,961 $ 2,700,500
Payment systems 6,191,802 6,112,957
Corporate 1,972 408,697
Total assets $ 8,630,735 $ 9,222,154
Geographic areas — Foreign operations are located principally in Europe. Foreign revenues are defined as revenues generated from money transfer
transactions originating in a country other than the United States. Long lived assets are principally located in the United States.
F-40