MoneyGram 2004 Annual Report Download - page 66
Download and view the complete annual report
Please find page 66 of the 2004 MoneyGram annual report below. You can navigate through the pages in the report by either clicking on the pages listed below, or by using the keyword search tool below to find specific information within the annual report.-
 1
1 -
2
-
3
-
4
-
5
-
6
-
7
-
8
-
9
-
10
-
11
-
12
-
13
-
14
-
15
-
16
-
17
-
18
-
19
-
20
-
21
-
22
-
23
-
24
-
25
-
26
-
27
-
28
-
29
-
30
-
31
-
32
-
33
-
34
-
35
-
36
-
37
-
38
-
39
-
40
-
41
-
42
-
43
-
44
-
45
-
46
-
47
-
48
-
49
-
50
-
51
-
52
-
53
-
54
-
55
-
 56
56 -
 57
57 -
 58
58 -
 59
59 -
 60
60 -
 61
61 -
 62
62 -
 63
63 -
 64
64 -
 65
65 -
 66
66 -
 67
67 -
 68
68 -
 69
69 -
 70
70 -
 71
71 -
 72
72 -
 73
73 -
 74
74 -
 75
75 -
 76
76 -
77
-
78
-
79
-
80
-
81
-
82
-
83
-
84
-
85
-
86
-
87
-
88
-
89
-
90
-
91
-
92
-
93
 |
 |
Table of Contents
MONEYGRAM INTERNATIONAL, INC. AND SUBSIDIARIES
NOTES TO CONSOLIDATED FINANCIAL STATEMENTS — (Continued)
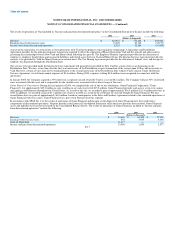
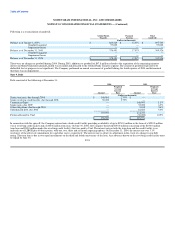
and represent a small percentage of the total assets in each trust. Our rights and obligations are limited to the receivables transferred, and the transactions are
accounted for as sales. The assets and liabilities associated with the trusts, including the sold receivables, are not recorded or consolidated in our financial
statements. The agreement expires in June 2006. The receivables are sold to accelerate the cash flow for investments. The aggregate amount of receivables
sold at any time cannot exceed $450.0 million. The balance of sold receivables as of December 31, 2004 and 2003 was $345.5 million and $329.2 million
respectively. The agreement includes a 5% holdback provision of the purchase price of the receivables. The average receivables sold approximated
$404.6 million and $428.1 million during 2004 and 2003, respectively. The expense of selling the agent receivables is included in the Consolidated Statement
of Income in "Investment commissions expense" and totaled $9.9 million, $9.5 million and $12.4 million during 2004, 2003 and 2002, respectively.
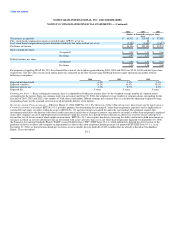
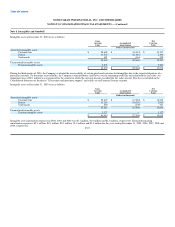
Note 7. Property and Equipment
Property and equipment consists of the following at December 31:
2004 2003
(Dollars in thousands)
Office furniture, equipment and leasehold improvements $ 20,166 $ 25,987
Agent equipment 102,679 106,845
Computer hardware and software 81,712 76,664
204,557 209,496
Accumulated depreciation (116,403) (114,289)
$ 88,154 $ 95,207
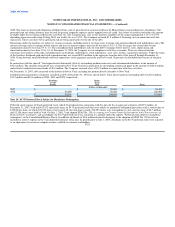
Depreciation expense for the year ended December 31 is as follows:
2004 2003 2002
(Dollars in thousands)
Depreciation of office furniture, equipment, and leasehold improvements $ 2,272 $ 2,319 $ 2,591
Depreciation on agent equipment 12,776 12,561 12,283
Amortization expense of capitalized software 12,453 10,514 9,176
Total depreciation expense $ 27,501 $ 25,394 $ 24,050
Included in computer hardware and software are capitalized software development costs. At December 31, 2004 and 2003, the net capitalized costs were
$31.4 million and $35.9 million, respectively.
During 2004, the Company determined that an impairment existed on $4.5 million of software costs related primarily to a joint development project with
Concord EFS utilizing ATMs to facilitate money transfers and other discontinued projects. The impairment loss was related to our Global Funds Transfer
segment and is included in the Consolidated Statement of Income in "Transaction and operations support."
F-22