MoneyGram 2004 Annual Report Download - page 18
Download and view the complete annual report
Please find page 18 of the 2004 MoneyGram annual report below. You can navigate through the pages in the report by either clicking on the pages listed below, or by using the keyword search tool below to find specific information within the annual report.-
 1
1 -
2
-
3
-
4
-
5
-
6
-
7
-
 8
8 -
 9
9 -
 10
10 -
 11
11 -
 12
12 -
 13
13 -
 14
14 -
 15
15 -
 16
16 -
 17
17 -
 18
18 -
 19
19 -
 20
20 -
 21
21 -
 22
22 -
 23
23 -
 24
24 -
 25
25 -
 26
26 -
 27
27 -
 28
28 -
29
-
30
-
31
-
32
-
33
-
34
-
35
-
36
-
37
-
38
-
39
-
40
-
41
-
42
-
43
-
44
-
45
-
46
-
47
-
48
-
49
-
50
-
51
-
52
-
53
-
54
-
55
-
56
-
57
-
58
-
59
-
60
-
61
-
62
-
63
-
64
-
65
-
66
-
67
-
68
-
69
-
70
-
71
-
72
-
73
-
74
-
75
-
76
-
77
-
78
-
79
-
80
-
81
-
82
-
83
-
84
-
85
-
86
-
87
-
88
-
89
-
90
-
91
-
92
-
93
 |
 |
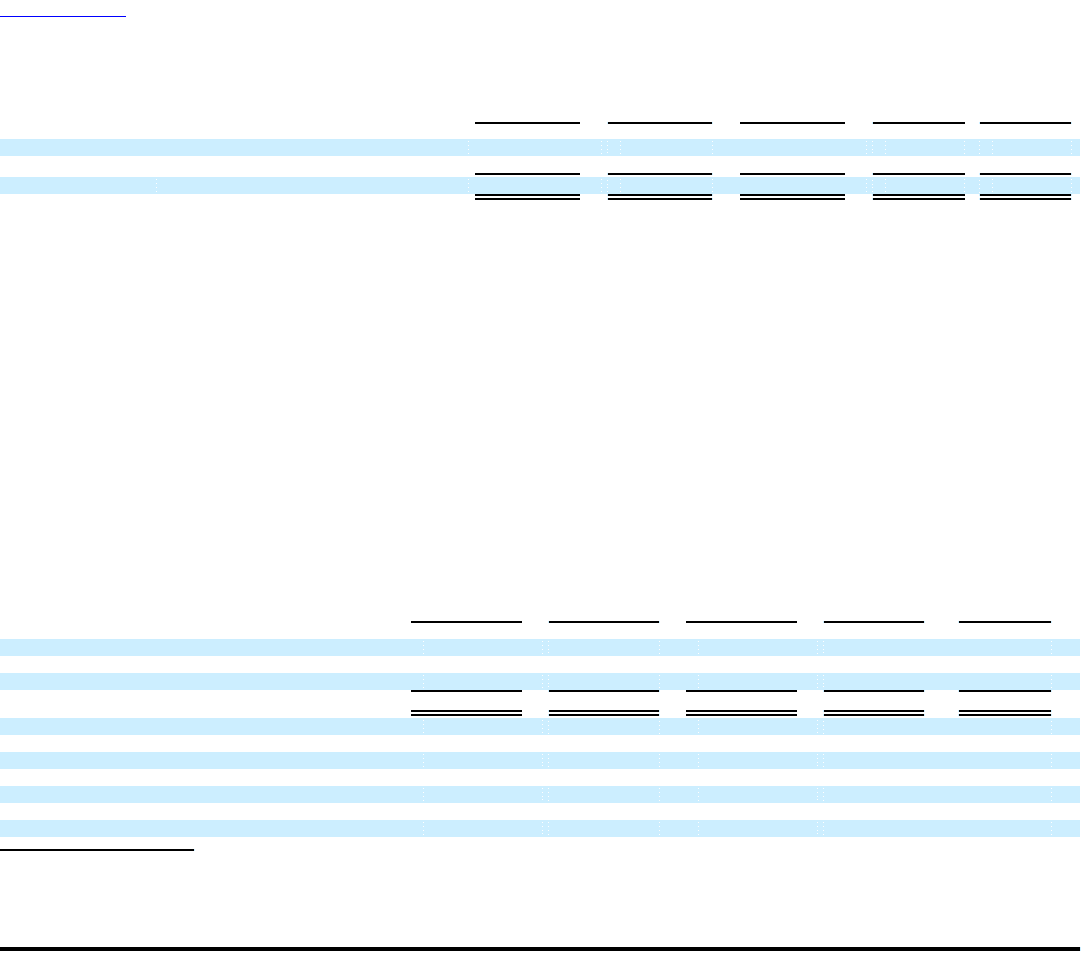
Table of Contents
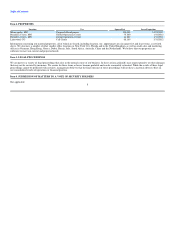
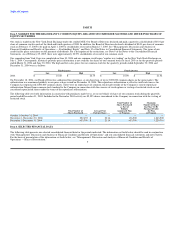
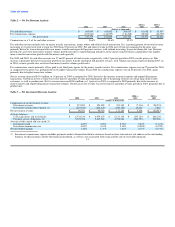
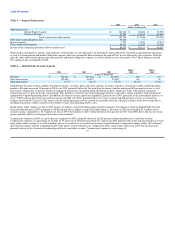
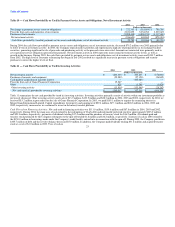
Table 2 — Net Fee Revenue Analysis
2004 vs 2003 vs
2004 2003 2002 2003 2002
(Dollars in thousands)
Fee and other revenue $ 500,940 $ 419,002 $ 365,635 $ 81,938 $ 53,367
Fee commissions expense (183,561) (144,997) (118,268) (38,564) (26,729)
Net fee revenue $ 317,379 $ 274,005 $ 247,367 $ 43,374 $ 26,638
Commissions as a % of fee and other revenue 36.6% 34.6% 32.3%
Fee and other revenue includes fees on money transfer transactions, money orders and official check transactions. It is a growing portion of our total revenue,
increasing to 61 percent of total revenue for 2004 from 52 percent in 2002. Fee and other revenue in 2004 grew 20 percent compared to the prior year,
primarily driven by transaction growth in our money transfer and urgent bill payment services, with volume increasing 36 percent during the year. Revenue
growth rates are lower than money transfer volume growth rates due to targeted pricing initiatives in the money transfer business and product mix (higher
money transfer transaction growth with flat money order growth).
For 2003 and 2002, fee and other revenue was 57 and 52 percent of total revenue, respectively, with 15 percent growth in 2003 over the prior year. This
increase is primarily driven by transaction growth in our money transfer and urgent bill payment services, with volume increasing 32 percent during 2003. As
in 2004, revenue growth rates are lower than money transfer volume growth rates.
Fee commissions consist primarily of fees paid to our third-party agents for the money transfer service. Fee commissions expense was up 27 percent for 2004
as compared to the prior year, primarily driven by higher transaction volume. Fiscal 2003 fee commissions expense was up 23 percent over 2002, again
primarily due to higher transaction volume.
Net fee revenue increased $43.4 million, or 16 percent, in 2004 as compared to 2003, driven by the increase in money transfer and urgent bill payment
transactions. Growth in net fee revenue was lower than fee and other revenue growth primarily due to the pricing structure of certain large money order
customers, as well as product mix. Net fee revenue increased $26.6 million, or 11 percent, in 2003 as compared to 2002 primarily due to the increase in
money transfer and urgent bill payment transaction volumes. Growth in net fee revenue was lower than fee and other revenue growth in 2003, primarily due to
product mix.
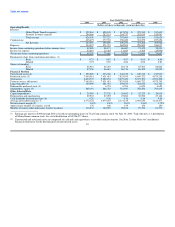
Table 3 — Net Investment Revenue Analysis
2004 vs 2003 vs
2004 2003 2002 2003 2002
(Dollars in thousands)
Components of net investment revenue:
Investment revenue $ 315,983 $ 323,099 $ 351,332 $ (7,116) $ (28,233)
Investment commissions expense (1) (219,912) (232,336) (240,152) 12,424 7,816
Net investment revenue $ 96,071 $ 90,763 $ 111,180 $ 5,308 $ (20,417)
Average balances:
Cash equivalents and investments $ 6,772,124 $ 6,979,247 $ 6,131,145 $ (207,123) $ 848,102
Payment service obligations (2) 5,370,768 5,615,562 4,706,324 (244,794) 909,238
Average yields earned and rates paid (3):
Investment yield 4.67% 4.63% 5.73% 0.04% (1.10%)
Investment commission rate 4.09% 4.14% 5.10% (0.04%) (0.97%)
Net investment margin 1.42% 1.30% 1.81% 0.12% (0.51%)
(1) Investment commissions expense includes payments made to financial institution customers based on short-term interest rate indices on the outstanding
balances of official checks sold by that financial institution, as well as costs associated with swaps and the sale of receivables program.
15