MoneyGram 2004 Annual Report Download - page 21
Download and view the complete annual report
Please find page 21 of the 2004 MoneyGram annual report below. You can navigate through the pages in the report by either clicking on the pages listed below, or by using the keyword search tool below to find specific information within the annual report.-
 1
1 -
2
-
3
-
4
-
5
-
6
-
7
-
8
-
9
-
10
-
 11
11 -
 12
12 -
 13
13 -
 14
14 -
 15
15 -
 16
16 -
 17
17 -
 18
18 -
 19
19 -
 20
20 -
 21
21 -
 22
22 -
 23
23 -
 24
24 -
 25
25 -
 26
26 -
 27
27 -
 28
28 -
 29
29 -
 30
30 -
 31
31 -
32
-
33
-
34
-
35
-
36
-
37
-
38
-
39
-
40
-
41
-
42
-
43
-
44
-
45
-
46
-
47
-
48
-
49
-
50
-
51
-
52
-
53
-
54
-
55
-
56
-
57
-
58
-
59
-
60
-
61
-
62
-
63
-
64
-
65
-
66
-
67
-
68
-
69
-
70
-
71
-
72
-
73
-
74
-
75
-
76
-
77
-
78
-
79
-
80
-
81
-
82
-
83
-
84
-
85
-
86
-
87
-
88
-
89
-
90
-
91
-
92
-
93
 |
 |

Table of Contents
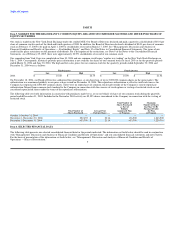
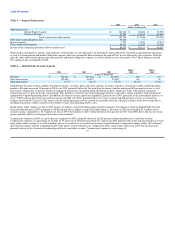
rates. Viad paid down $249.6 million of debt in 2004 in connection with the spin-off. Beginning in the second half of 2004, interest expense incurred relates
to the $150.0 million MoneyGram borrowed under its credit facility on June 30, 2004 in connection with the spin-off. Interest expense on this MoneyGram
debt was $2.4 million in 2004, including amortization of deferred financing costs. Interest expense in 2003 declined 35 percent over 2002 due to lower
average interest rates and lower average outstanding debt balances resulting from $100.0 million of medium-term senior notes that matured in 2003.
Debt tender and redemption costs — Debt tender and redemption costs incurred during 2004 of $20.7 million relate to the redemption of Viad's preferred
shares and tender for its subordinated debt and medium term notes in connection with the spin-off. No such costs were incurred in 2003 or 2002. These costs
will not recur in 2005.
Income taxes — The effective tax rate was 27 percent in 2004 compared to 14 percent in 2003. The corporate tax rate is lower than the statutory rate due
primarily to income from tax-exempt bonds in our investment portfolio. The 2004 effective tax rate is higher than 2003 mainly due to the costs related to the
redemption of Viad's redeemable preferred shares, which are not tax deductible. We expect our marginal tax rate to be approximately 25 percent in 2005. The
effective tax rate for 2003 remained stable from 2002.
Segment Performance
We measure financial performance by our two business segments:
Global Funds Transfer — this segment provides global money transfer services, money orders and bill payment services to consumers through a network of
agents. Fee revenue is driven by transaction volume and fees per transaction. In addition, investment and related income is generated by investing funds
received from the sale of money orders until the instruments are settled.
Payment Systems — this segment provides financial institutions with payment processing services, primarily official check outsourcing services and money
orders for sale to their customers, and processes controlled disbursements. Investment and related income is generated by investing funds received from the
sale of payment instruments until the instruments are settled. In addition, revenue is derived from per-item fees paid by our financial institution customers.
The business segments are determined based upon factors such as the type of customers, the nature of products and services provided and the distribution
channels used to provide those services. Segment pre-tax operating income and segment operating margin are used to evaluate performance and allocate
resources.
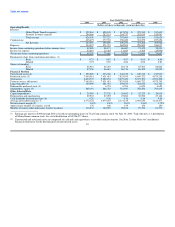
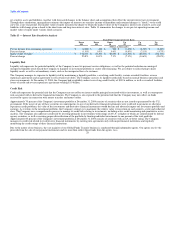
We manage our investment portfolio on a consolidated level and the specific investment securities are not identifiable to a particular segment. However,
average investable balances are allocated to our segments based upon the average balances generated by that segment's sale of payment instruments. The
investment yield is generally allocated based upon the total average investment yield. Gains and losses are allocated based upon the allocation of average
investable balances. Our derivatives portfolio is also managed on a consolidated level and the derivative instruments are not specifically identifiable to a
particular segment. The total costs associated with our derivatives portfolio are allocated to each segment based upon the percentage of that segment's average
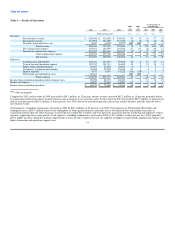
investable balances to the total average investable balances. Table 5 reconciles segment operating income to income from continuing operations before
income taxes as reported in the financial statements. 18