MoneyGram 2004 Annual Report Download - page 62
Download and view the complete annual report
Please find page 62 of the 2004 MoneyGram annual report below. You can navigate through the pages in the report by either clicking on the pages listed below, or by using the keyword search tool below to find specific information within the annual report.-
 1
1 -
2
-
3
-
4
-
5
-
6
-
7
-
8
-
9
-
10
-
11
-
12
-
13
-
14
-
15
-
16
-
17
-
18
-
19
-
20
-
21
-
22
-
23
-
24
-
25
-
26
-
27
-
28
-
29
-
30
-
31
-
32
-
33
-
34
-
35
-
36
-
37
-
38
-
39
-
40
-
41
-
42
-
43
-
44
-
45
-
46
-
47
-
48
-
49
-
50
-
51
-
 52
52 -
 53
53 -
 54
54 -
 55
55 -
 56
56 -
 57
57 -
 58
58 -
 59
59 -
 60
60 -
 61
61 -
 62
62 -
 63
63 -
 64
64 -
 65
65 -
 66
66 -
 67
67 -
 68
68 -
 69
69 -
 70
70 -
 71
71 -
 72
72 -
73
-
74
-
75
-
76
-
77
-
78
-
79
-
80
-
81
-
82
-
83
-
84
-
85
-
86
-
87
-
88
-
89
-
90
-
91
-
92
-
93
 |
 |

Table of Contents
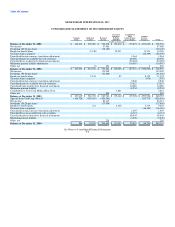
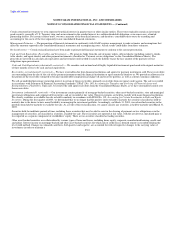
MONEYGRAM INTERNATIONAL, INC. AND SUBSIDIARIES
NOTES TO CONSOLIDATED FINANCIAL STATEMENTS — (Continued)
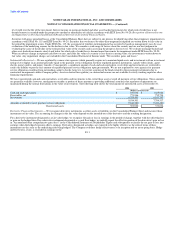
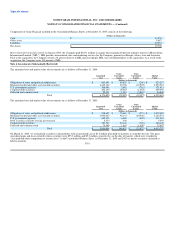
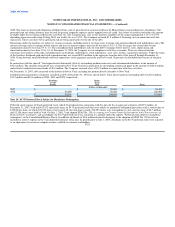
Components of Game Financial included in the Consolidated Balance Sheets at December 31, 2003 consists of the following:
(Dollars in thousands)
Cash $ 33,576
Other assets 8,687
Liabilities 22,557
Net Assets $ 19,706
MoneyGram International Limited: In January 2003, the Company paid $105.1 million to acquire the remaining 49 percent minority interest in MoneyGram
International Limited ("MIL"). MIL provides international sales and marketing services for the Company, primarily in Europe, Africa, Asia and Australia.
Prior to the acquisition, the Company owned a 51 percent interest in MIL and accordingly, MIL was consolidated prior to the acquisition. As a result of the
acquisition, the Company owns 100 percent of MIL.
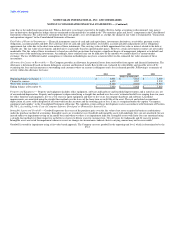
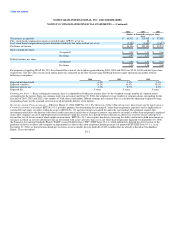
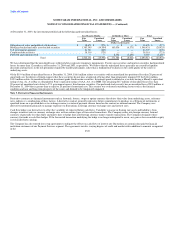
Note 4. Investments (Substantially Restricted)
The amortized cost and market value of investments are as follows at December 31, 2004:
Gross Gross
Amortized Unrealized Unrealized Market
Cost Gains Losses Value
(Dollars in thousands)
Obligations of states and political subdivisions $ 863,691 $ 59,855 $ (249) $ 923,297
Mortgage-backed and other asset-backed securities 4,442,162 94,706 (12,905) 4,523,963
U.S. government agencies 369,446 2,683 (718) 371,411
Corporate debt securities 442,145 19,463 (1,652) 459,956
Preferred and common stock 59,411 1,318 (3,863) 56,866
Total $ 6,176,855 $ 178,025 $ (19,387) $ 6,335,493
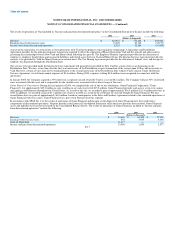
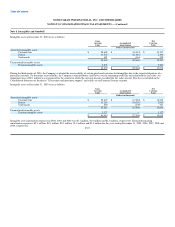
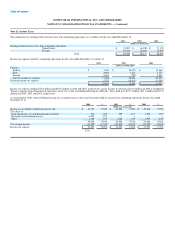
The amortized cost and market value of investments are as follows at December 31, 2003:
Gross Gross
Amortized Unrealized Unrealized Market
Cost Gains Losses Value
(Dollars in thousands)
Obligations of states and political subdivisions $ 938,693 $ 73,663 $ (271) $ 1,012,085
Mortgage-backed and other asset-backed securities 4,092,067 92,131 (20,926) 4,163,272
U.S. government agencies 405,378 6,068 (405) 411,041
Debt securities issued by foreign governments 5,373 320 — 5,693
Corporate debt securities 323,747 23,142 (720) 346,169
Preferred and common stock 75,546 1,601 (1,650) 75,497
Total $ 5,840,804 $ 196,925 $ (23,972) $ 6,013,757
On March 31, 2003, we reclassified securities in the portfolio with an amortized cost of $1.2 billion from held-to-maturity to available-for-sale. The gross
unrealized gains and losses related to these securities were $55.3 million and $5.3 million, respectively, on the date of transfer, which were recorded in
"Accumulated other comprehensive income (loss)" in the Consolidated Balance Sheet. At December 31, 2004 and 2003 we had no securities classified as
held-to-maturity. F-18