MoneyGram 2004 Annual Report Download - page 59
Download and view the complete annual report
Please find page 59 of the 2004 MoneyGram annual report below. You can navigate through the pages in the report by either clicking on the pages listed below, or by using the keyword search tool below to find specific information within the annual report.-
 1
1 -
2
-
3
-
4
-
5
-
6
-
7
-
8
-
9
-
10
-
11
-
12
-
13
-
14
-
15
-
16
-
17
-
18
-
19
-
20
-
21
-
22
-
23
-
24
-
25
-
26
-
27
-
28
-
29
-
30
-
31
-
32
-
33
-
34
-
35
-
36
-
37
-
38
-
39
-
40
-
41
-
42
-
43
-
44
-
45
-
46
-
47
-
48
-
 49
49 -
 50
50 -
 51
51 -
 52
52 -
 53
53 -
 54
54 -
 55
55 -
 56
56 -
 57
57 -
 58
58 -
 59
59 -
 60
60 -
 61
61 -
 62
62 -
 63
63 -
 64
64 -
 65
65 -
 66
66 -
 67
67 -
 68
68 -
 69
69 -
70
-
71
-
72
-
73
-
74
-
75
-
76
-
77
-
78
-
79
-
80
-
81
-
82
-
83
-
84
-
85
-
86
-
87
-
88
-
89
-
90
-
91
-
92
-
93
 |
 |
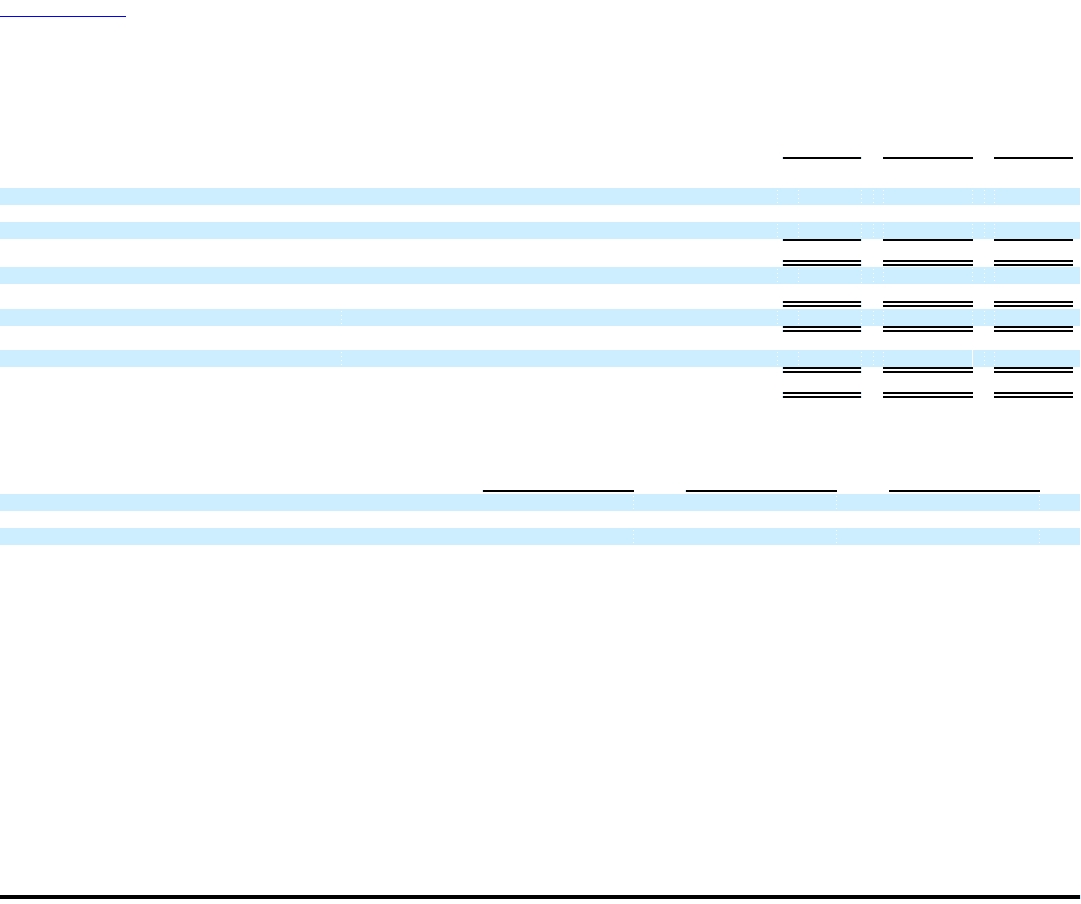
Table of Contents
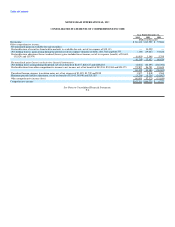
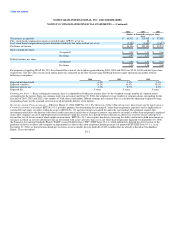
MONEYGRAM INTERNATIONAL, INC. AND SUBSIDIARIES
NOTES TO CONSOLIDATED FINANCIAL STATEMENTS — (Continued)
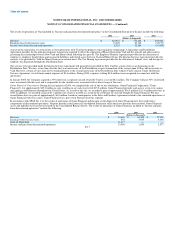
2004 2003 2002
(Dollars in thousands, except per share
data)
Net income, as reported $ 86,412 $ 113,902 $ 57,886
Plus: stock-based compensation expense recorded under APB 25, net of tax — 28 —
Less: stock-based compensation expense determined under the fair value method, net of tax (2,386) (4,680) (5,612)
Pro forma net income $ 84,026 $ 109,250 $ 52,274
Basic earnings per share:
As reported $ 0.99 $ 1.31 $ 0.66
Pro forma 0.97 1.27 0.61
Diluted earnings per share:
As reported $ 0.99 $ 1.31 $ 0.65
Pro forma 0.96 1.26 0.60
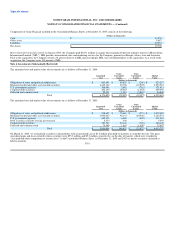
For purposes of applying SFAS No. 123, the estimated fair value of stock options granted during 2004, 2003 and 2002 was $5.49, $4.00 and $6.03 per share,
respectively. The fair value of each stock option grant was estimated on the date of grant using the Black-Scholes single option pricing model with the
following assumptions:
2004 2003 2002
Expected dividend yield 0.2% 1.8% 1.3%
Expected volatility 25.2% 30.4% 30.1%
Risk-free interest rate 3.2% 2.7% 4.9%
Expected life 5 years 5 years 5 years
Earnings per share — Basic earnings per common share is computed by dividing net income (loss) by the weighted average number of common shares
outstanding for the period. Since our common stock was not issued until June 30, 2004, the weighted average number of common shares outstanding for the
first half of 2004, 2003 and 2002 is the number of Viad shares outstanding. Diluted earnings per common share is calculated by adjusting weighted average
outstanding shares for the assumed conversion of all potentially dilutive stock options.
Recent Accounting Pronouncements — Effective March 31, 2004, EITF No. 03-1, The Meaning of Other-Than-Temporary Impairment and Its Application to
Certain Investments, was issued. EITF No. 03-1 provides guidance for determining the meaning of "other-than-temporarily impaired" and its application to
certain debt and equity securities within the scope of SFAS No. 115 and investments accounted for under the cost method. The guidance requires that
investments which have declined in value due to credit concerns or solely due to changes in interest rates must be recorded as other-than-temporarily impaired
unless the Company can assert and demonstrate its intention to hold the security for a period of time sufficient to allow for a recovery of fair value up to or
beyond the cost of the investment which might mean maturity. EITF No. 03-1 also requires disclosures assessing the ability and intent to hold investments in
instances in which an investor determines that an investment with a fair value less than cost is not other-than-temporarily impaired. On September 30, 2004,
the Financial Accounting Standards Board ("FASB") issued Staff Position ("FSP") EITF Issue 03-1-1, which indefinitely delayed the effective date of the
guidance on how to evaluate and recognize an impairment loss that is other than temporary, pending issuance of proposed FSP EITF Issue 03-1-a. As of
December 31, 2004, we had total unrealized pre-tax losses in our available-for-sale portfolio of $19.4 million that are already reflected in Stockholders'
Equity. These unrealized F-15