MoneyGram 2004 Annual Report Download - page 19
Download and view the complete annual report
Please find page 19 of the 2004 MoneyGram annual report below. You can navigate through the pages in the report by either clicking on the pages listed below, or by using the keyword search tool below to find specific information within the annual report.-
 1
1 -
2
-
3
-
4
-
5
-
6
-
7
-
8
-
 9
9 -
 10
10 -
 11
11 -
 12
12 -
 13
13 -
 14
14 -
 15
15 -
 16
16 -
 17
17 -
 18
18 -
 19
19 -
 20
20 -
 21
21 -
 22
22 -
 23
23 -
 24
24 -
 25
25 -
 26
26 -
 27
27 -
 28
28 -
 29
29 -
30
-
31
-
32
-
33
-
34
-
35
-
36
-
37
-
38
-
39
-
40
-
41
-
42
-
43
-
44
-
45
-
46
-
47
-
48
-
49
-
50
-
51
-
52
-
53
-
54
-
55
-
56
-
57
-
58
-
59
-
60
-
61
-
62
-
63
-
64
-
65
-
66
-
67
-
68
-
69
-
70
-
71
-
72
-
73
-
74
-
75
-
76
-
77
-
78
-
79
-
80
-
81
-
82
-
83
-
84
-
85
-
86
-
87
-
88
-
89
-
90
-
91
-
92
-
93
 |
 |

Table of Contents
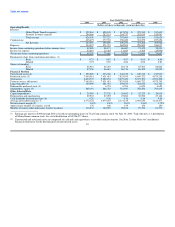
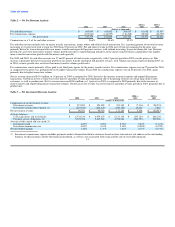
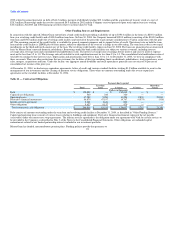
(2) Commissions are paid to financial institution customers based upon average outstanding balances generated by the sale of official checks only. The
average balance in the table reflects only the payment service obligations for which commissions are paid and does not include the average balance of the
sold receivables ($404.6 million, $428.1 and $440.0 million for 2004, 2003 and 2002, respectively) as these are not recorded in the Consolidated Balance
Sheets.
(3) Average yields/rates are calculated by dividing the applicable amount shown in the "Components of net investment revenue" section by the applicable
amount shown in the "Average balances" section. The "Net investment margin" is calculated by dividing "Net investment revenue" by the "Cash
equivalents and investments" average balance.
Investment revenue declined two percent in 2004 over 2003, primarily driven by lower average investable balances. The higher average investable balances in
2003 resulted from the unprecedented mortgage refinancing activity that occurred during late 2002 and into 2003 due to the dramatic decline in interest rates.
Refinancing activities caused an increase in the sale of official checks and, therefore, an increase in our average investable balances. In 2004, the refinancing
activity declined, causing average investable balances to decline. The refinancing activity in 2003 also caused a significant increase in the prepayments of
mortgage-backed debt securities in our investment portfolio, the proceeds of which we reinvested at lower interest rates. Investment revenue decreased eight
percent in 2003 versus 2002, primarily due to our reinvestment in lower interest rate securities resulting from the significant prepayments of mortgage-backed
debt securities, partially offset by higher average investable balances.
Investment commissions expense in 2004 declined by five percent from 2003, primarily due to lower swap costs, partially offset by higher commissions paid
to financial institution customers as a result of higher short-term rates. Lower swap costs are the result of maturing high rate swaps being replaced by lower
rate swaps, increases in the short-term rates and lower notional swap balances. Investment commissions expense in 2003 decreased by three percent from
2002, primarily due to lower swap balances and lower commissions paid to financial institution customers as short-term interest rates declined in 2003.
Net investment revenue increased by six percent in 2004 compared to 2003, with the net investment margin increasing 12 basis points to 1.42 percent. During
the same period, the average Fed Funds rate increased 22 basis points and the average 5-year U.S. Treasury Note increased 47 basis points. The
unprecedented mortgage refinancing activity in 2003 and 2002 caused the net investment margin to fall 51 basis points in 2003, while the 2004 net investment
margins benefited from declining swap costs. Net investment revenue decreased by 18 percent in 2003 compared to 2002, with the net investment margin
declining 51 basis points to 1.30 percent. During the same period, the Fed Funds rate declined 54 basis points and the 5-year U.S. Treasury Note declined
93 basis points.
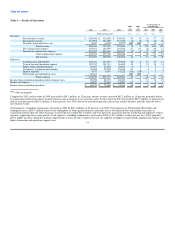
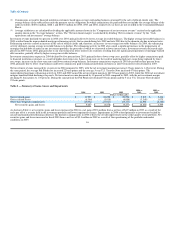
Table 4 — Summary of Gains, Losses and Impairments
2004 vs 2003 vs
2004 2003 2002 2003 2002
(Dollars in thousands)
Gross realized gains $ 31,903 $ 26,058 $ 20,594 $ 5,845 $ 5,464
Gross realized losses (6,364) (3,019) (4,094) (3,345) 1,075
Other-than-temporary impairments (15,932) (27,917) (25,777) 11,985 (2,140)
Net securities gains and losses $ 9,607 $ (4,878) $ (9,277) $ 14,485 $ 4,399
As shown in Table 4, net securities gains and losses increased in 2004 to a net gain of $9.6 million from a net loss of $4.9 million in 2003 as a result of the
early pay off of a security held in the investment portfolio and lower impairment charges. Impairments in 2004 related primarily to investments backed by
aircraft and manufactured housing collateral. The decline in impairments in 2004 reflects the overall improvement in the credit quality of our portfolio. Net
securities gains and losses increased in fiscal 2003 from a net loss of $9.3 million in 2002 as a result of the repositioning of the portfolio and market
conditions in 2003. 16