MoneyGram 2004 Annual Report Download - page 31
Download and view the complete annual report
Please find page 31 of the 2004 MoneyGram annual report below. You can navigate through the pages in the report by either clicking on the pages listed below, or by using the keyword search tool below to find specific information within the annual report.-
 1
1 -
2
-
3
-
4
-
5
-
6
-
7
-
8
-
9
-
10
-
11
-
12
-
13
-
14
-
15
-
16
-
17
-
18
-
19
-
20
-
 21
21 -
 22
22 -
 23
23 -
 24
24 -
 25
25 -
 26
26 -
 27
27 -
 28
28 -
 29
29 -
 30
30 -
 31
31 -
 32
32 -
 33
33 -
 34
34 -
 35
35 -
 36
36 -
 37
37 -
 38
38 -
 39
39 -
 40
40 -
 41
41 -
42
-
43
-
44
-
45
-
46
-
47
-
48
-
49
-
50
-
51
-
52
-
53
-
54
-
55
-
56
-
57
-
58
-
59
-
60
-
61
-
62
-
63
-
64
-
65
-
66
-
67
-
68
-
69
-
70
-
71
-
72
-
73
-
74
-
75
-
76
-
77
-
78
-
79
-
80
-
81
-
82
-
83
-
84
-
85
-
86
-
87
-
88
-
89
-
90
-
91
-
92
-
93
 |
 |

Table of Contents
est sensitive assets and liabilities, together with forecasted changes in the balance sheet and assumptions that reflect the current interest rate environment.
Through these simulations, management estimates the impact on interest rate sensitive income of immediate and sustained changes (a "shock") to the yield
curve for a one-year period. The market value of equity measures the degree to which the market values of the Company's interest rate sensitive assets and
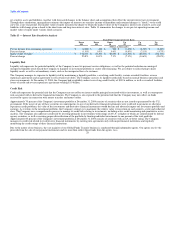
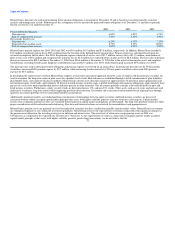
liabilities will change given a shock to the short-term and long-term interest rates. Table 13 summarizes the changes to our pre-tax operating income and
market value of equity under various shock scenarios.
Table 13 — Interest Rate Sensitivity Analysis
Basis Point Change in Interest Rates
Down Down Down Up Up Up
200 100 50 50 100 200
(Dollars in thousands)
Pre-tax income from continuing operations $ (1,300) $ 600 $ 500 $ (1,100) $ (2,700) $ (6,200)
Percent change (1.0%) 0.5% 0.4% (0.8%) (2.1%) (4.7%)
Market value of equity $ 146,800 $ 80,400 $ 40,400 $ (41,300) $ (83,000) $ (164,100)
Percent change 25.8% 14.1% 7.1% (7.3%) (14.6%) (28.9%)
Liquidity Risk
Liquidity risk represents the potential inability of the Company to meet its payment service obligations, as well as the potential reduction in earnings if
unexpected liquidity needs forced the Company to liquidate its investment portfolio or secure other financing. We are subject to risks relating to daily
liquidity needs, as well as extraordinary events, such as the unexpected loss of a customer.
The Company manages its exposure to liquidity risk by maintaining a liquidity portfolio, a revolving credit facility, various overdraft facilities, reverse
repurchase agreements and an agreement to sell certain receivables. The Company assesses its liquidity needs daily based on normal business operations and
stress environments. At December 31, 2004, the Company had availability under its revolving credit facility of $139.6 million, as well as overdraft facilities,
letters of credit and reverse repurchase agreements totaling $1.9 billion.
Credit Risk
Credit risk represents the potential risk that the Company may not collect on interest and/or principal associated with its investments, as well as counterparty
risk associated with its derivative financial instruments. The Company is also exposed to the potential risk that the Company may not collect on funds
received by agents in connection with money transfers and money orders.
Approximately 70 percent of the Company's investment portfolio at December 31, 2004 consists of securities that are not issued or guaranteed by the U.S.
government. If the issuer of any of these securities or counterparties to any of our derivative financial instruments were to default in payments or otherwise
experience credit problems, the value of the investments and derivative financial instruments would decline and adversely impact our investment portfolio and
earnings. As it relates to the investment portfolio, the Company's strategy is to maximize the relative value versus return on each security, sector and collateral
class. The Company uses a comprehensive process to manage its credit risk relating to investments, including active credit monitoring and quantitative sector
analysis. The Company also addresses credit risk by investing primarily in investments with ratings of A3/ A- or higher or which are collateralized by federal
agency securities, as well as ensuring proper diversification of the portfolio by limiting individual investments to one percent of the total portfolio.
Approximately 80 percent of the Company's investment portfolio at December 31, 2004 consists of securities with an AA or better rating. The Company
manages its credit risk related to its derivative financial instruments by entering into agreements only with major financial institutions and regularly
monitoring the credit ratings of these financial institutions.
Due to the nature of our business, the vast majority of our Global Funds Transfer business is conducted through independent agents. Our agents receive the
proceeds from the sale of our payment instruments and we must then collect these funds from the agents. As a
28