MoneyGram 2004 Annual Report Download - page 22
Download and view the complete annual report
Please find page 22 of the 2004 MoneyGram annual report below. You can navigate through the pages in the report by either clicking on the pages listed below, or by using the keyword search tool below to find specific information within the annual report.-
 1
1 -
2
-
3
-
4
-
5
-
6
-
7
-
8
-
9
-
10
-
11
-
 12
12 -
 13
13 -
 14
14 -
 15
15 -
 16
16 -
 17
17 -
 18
18 -
 19
19 -
 20
20 -
 21
21 -
 22
22 -
 23
23 -
 24
24 -
 25
25 -
 26
26 -
 27
27 -
 28
28 -
 29
29 -
 30
30 -
 31
31 -
 32
32 -
33
-
34
-
35
-
36
-
37
-
38
-
39
-
40
-
41
-
42
-
43
-
44
-
45
-
46
-
47
-
48
-
49
-
50
-
51
-
52
-
53
-
54
-
55
-
56
-
57
-
58
-
59
-
60
-
61
-
62
-
63
-
64
-
65
-
66
-
67
-
68
-
69
-
70
-
71
-
72
-
73
-
74
-
75
-
76
-
77
-
78
-
79
-
80
-
81
-
82
-
83
-
84
-
85
-
86
-
87
-
88
-
89
-
90
-
91
-
92
-
93
 |
 |

Table of Contents
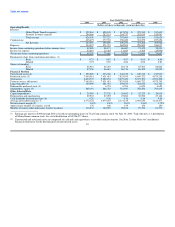
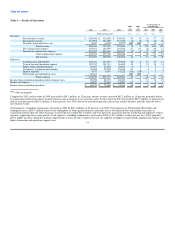
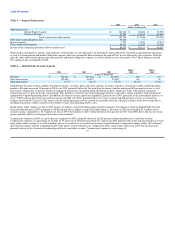
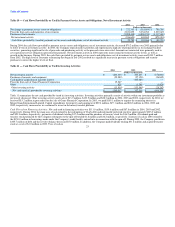
Table 5 — Segment Information
2004 2003 2002
(Dollars in thousands)
Operating income:
Global Funds Transfer $ 102,606 $ 96,823 $ 93,909
Payment Systems 27,163 15,123 21,658
Total segment operating income 129,769 111,946 115,567
Debt tender and redemption costs 20,661 — —
Interest expense 5,573 9,857 15,212
Other unallocated expenses 14,515 13,918 13,668
Income from continuing operations before income taxes $ 89,020 $ 88,171 $ 86,687
Other unallocated expenses include Viad corporate overhead that was not allocated to its subsidiaries and could not be classified as discontinued operations,
as well as certain pension and benefit obligation expenses that were retained by MoneyGram in the spin-off that are not allocated to the segments. After the
spin-off, other unallocated expense represents pension and benefit obligation expense, as well as interim service fees paid to Viad. These expenses totaled
$4.3 million in the second half of 2004.
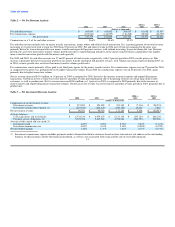
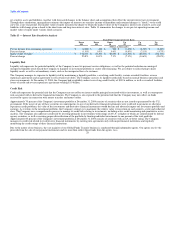
Table 6 — Global Funds Transfer Segment
2004 vs 2003 vs
2004 2003 2002 2003 2002
(Dollars in thousands)
Revenue $ 532,064 $ 450,108 $ 412,953 18% 9%
Operating income 102,606 96,823 93,909 6% 3%
Operating margin 19.3% 21.5% 22.7% (2.2%) (1.2%)
Global Funds Transfer revenue includes investment revenue, securities gains and losses and fees on money transfers, retail money orders and bill payment
products. Revenue increased 18 percent in 2004 over 2003, primarily driven by the growth in the money transfer and urgent bill payment services as total
transaction volume grew 36 percent. Domestic originated transactions (including urgent bill payment) grew 38 percent, while international originated
transactions grew 31 percent for the same periods. This growth is a result of our targeted pricing initiatives to provide a strong consumer value proposition
supported by targeted marketing efforts. In addition, the money transfer agent base expanded 22 percent over 2003, primarily in the international markets, to
over 77,000 locations. Revenue increased nine percent in 2003 over 2002, primarily driven by money transfer and bill payment services as transaction
volumes increased by 32 percent. The money transfer and bill payment services growth was partially offset by a decline in money order fee revenue due to
declining transaction volumes and lower investment revenue from declining interest rates.
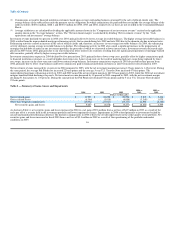
Retail money order volume was flat in 2004, despite an industry trend of declining paper-based instruments. Investment revenue in Global Funds Transfer
increased four percent in 2004 compared to 2003 primarily due to higher average investable balances. Revenue in 2004 also included $2.3 million in net
securities gains, compared to a $1.0 million net loss in 2003. Retail money order volume declined seven percent in 2003 from 2002 due to the loss of certain
agents, partially offset by strong growth in sales at one customer.
Commissions expense in 2004 was up 24 percent compared to 2003, primarily driven by the 20 percent combined growth in fee and other revenue.
Commissions expense as a percentage of revenue of 39.2 percent in 2004 increased from 36.7 percent in 2003 primarily due to the pricing structure of certain
large money order customers, as well as product mix as we continue to see growth in the money transfer business compared to money orders. We anticipate
this trend to continue with the continued growth of the money transfer business. As compared to 2002, commissions expense in 2003 was up 16 percent,
primarily driven by the 16 percent combined growth in fee and other revenue. Commissions expense as a percentage of
19