MoneyGram 2004 Annual Report Download - page 23
Download and view the complete annual report
Please find page 23 of the 2004 MoneyGram annual report below. You can navigate through the pages in the report by either clicking on the pages listed below, or by using the keyword search tool below to find specific information within the annual report.-
 1
1 -
2
-
3
-
4
-
5
-
6
-
7
-
8
-
9
-
10
-
11
-
12
-
 13
13 -
 14
14 -
 15
15 -
 16
16 -
 17
17 -
 18
18 -
 19
19 -
 20
20 -
 21
21 -
 22
22 -
 23
23 -
 24
24 -
 25
25 -
 26
26 -
 27
27 -
 28
28 -
 29
29 -
 30
30 -
 31
31 -
 32
32 -
 33
33 -
34
-
35
-
36
-
37
-
38
-
39
-
40
-
41
-
42
-
43
-
44
-
45
-
46
-
47
-
48
-
49
-
50
-
51
-
52
-
53
-
54
-
55
-
56
-
57
-
58
-
59
-
60
-
61
-
62
-
63
-
64
-
65
-
66
-
67
-
68
-
69
-
70
-
71
-
72
-
73
-
74
-
75
-
76
-
77
-
78
-
79
-
80
-
81
-
82
-
83
-
84
-
85
-
86
-
87
-
88
-
89
-
90
-
91
-
92
-
93
 |
 |

Table of Contents
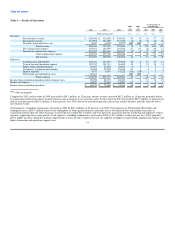
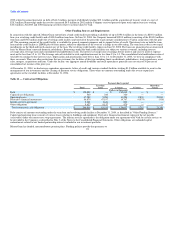
revenue increased from 34.5 percent in 2002 due to the shift in business mix towards money transfer.
Operating income in 2004 includes $2.3 million in net securities gains and a $4.5 million charge for capitalized technology costs. The operating margin of
19.3 percent in 2004 decreased from the margin of 21.5 percent in 2003 as a result of the product mix shift from retail money orders to money transfer, as well
as the decline in margins of the retail money order business. Fiscal 2003 operating margin decreased from 2002 operating margin of 22.7 due to the product
mix shift to money transfer.
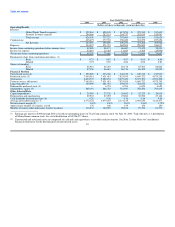
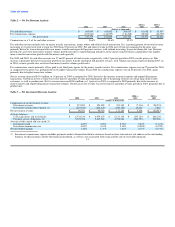
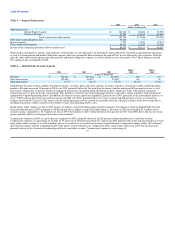
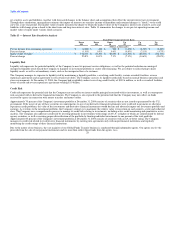
Table 7 — Payment Systems Segment
2004 vs 2003 vs
2004 2003 2002 2003 2002
(Dollars in thousands)
Revenue $ 294,466 $ 287,115 $ 294,737 3% (3%)
Operating income 27,163 15,123 21,658 80% (30%)
Operating margin 9.2% 5.3% 7.3%
Taxable equivalent basis (1):
Revenue $ 315,207 $ 312,627 $ 323,195 1% (3%)
Operating income 47,905 40,635 50,116 18% (19%)
Operating margin 15.2% 13.0% 15.5%
(1) The taxable equivalent basis numbers are non-GAAP measures that are used by the Company's management to evaluate the effect of tax-exempt securities
on the Payment Systems segment. The tax-exempt investments in the investment portfolio have lower pre-tax yields, but produce higher income on an after-
tax basis than comparable taxable investments. An adjustment is made to present revenue and operating income resulting from amounts invested in tax-
exempt securities on a taxable equivalent basis. The adjustment is calculated using a 35 percent tax rate and is $20.7 million, $25.5 million and $28.5 million
for 2004, 2003 and 2002, respectively. The presentation of taxable equivalent basis numbers is supplemental to results presented under GAAP and may not be
comparable to similarly titled measures used by other companies. These non-GAAP measures should be used in addition to, but not as a substitute for
measures presented under GAAP.
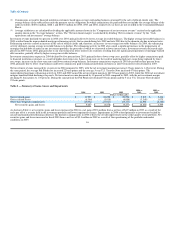
Payment Systems revenue includes investment revenue, securities gains and losses, per-item fees charged to our official check financial institution customers
and fees earned on our rebate processing business. Revenue increased three percent during 2004 compared to 2003, due to an increase in net securities gains
and fee revenue, partially offset by a decline in investment revenue. Net securities gains increased $11.2 million during 2004 primarily because of the early
pay off of a security held in the portfolio, partially offset by impairments of certain securities and realized losses from repositioning the portfolio. Investment
revenue declined four percent during 2004 compared to 2003 primarily due to lower investable balances as the heavy consumer refinancing activity during
2003 declined. Revenue decreased three percent during 2003 as compared to 2002, primarily due to the interest rate environment. The lower interest rates
earned in 2003 were primarily due to the unprecedented mortgage refinance activity, which caused higher average float balances and prepayments of
mortgage-backed debt securities held in the portfolio. The higher float balances and proceeds from prepayments were reinvested in investments with lower
interest rates than those seen in 2002. This caused the average investment yield to decline 110 basis points in 2003 to 4.63 percent from 5.73 percent in 2002.
Commissions expense includes payments made to financial institution customers based on official check average investable balances and short-term interest
rate indices, as well as costs associated with swaps and the sale of receivables program. Commissions expense declined six percent in 2004 as compared to
2003, primarily due to lower swap costs, partially offset by higher commissions paid to financial institution customers. Commissions expense decreased two
percent in 2003 as compared to 2002, primarily due to lower commissions paid to financial institution customers, partially offset by higher swap costs.
The operating margin for 2004 increased to 9.2 percent (15.2 percent on a taxable equivalent basis) as compared to 2003 operating margin of 5.3 percent
(13.0 percent on a taxable equivalent basis), primarily due to higher net securities gains. Operating income in 2004 includes $7.3 million of net securities
gains and a 20