MoneyGram 2004 Annual Report Download - page 13
Download and view the complete annual report
Please find page 13 of the 2004 MoneyGram annual report below. You can navigate through the pages in the report by either clicking on the pages listed below, or by using the keyword search tool below to find specific information within the annual report.-
 1
1 -
2
-
 3
3 -
 4
4 -
 5
5 -
 6
6 -
 7
7 -
 8
8 -
 9
9 -
 10
10 -
 11
11 -
 12
12 -
 13
13 -
 14
14 -
 15
15 -
 16
16 -
 17
17 -
 18
18 -
 19
19 -
 20
20 -
 21
21 -
 22
22 -
 23
23 -
24
-
25
-
26
-
27
-
28
-
29
-
30
-
31
-
32
-
33
-
34
-
35
-
36
-
37
-
38
-
39
-
40
-
41
-
42
-
43
-
44
-
45
-
46
-
47
-
48
-
49
-
50
-
51
-
52
-
53
-
54
-
55
-
56
-
57
-
58
-
59
-
60
-
61
-
62
-
63
-
64
-
65
-
66
-
67
-
68
-
69
-
70
-
71
-
72
-
73
-
74
-
75
-
76
-
77
-
78
-
79
-
80
-
81
-
82
-
83
-
84
-
85
-
86
-
87
-
88
-
89
-
90
-
91
-
92
-
93
 |
 |
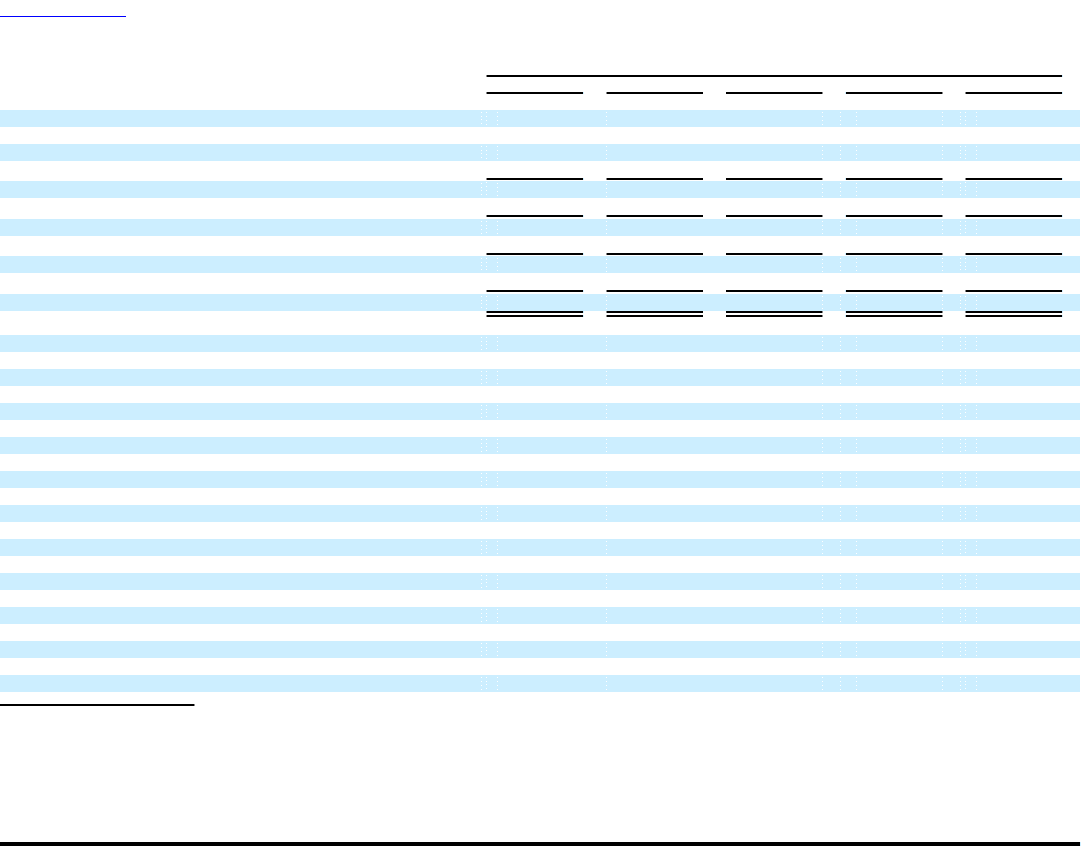
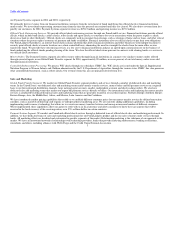
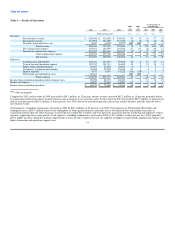
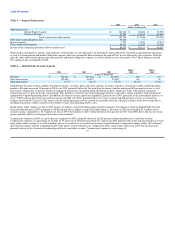
Table of Contents
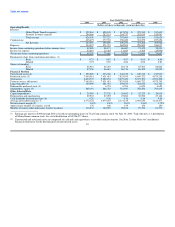
Years Ended December 31
2004 2003 2002 2001 2000
(Dollars and shares in thousands, except per share data)
Operating Results
Revenue
Global Funds Transfer segment $ 532,064 $ 450,108 $ 412,953 $ 379,945 $ 337,633
Payment Systems segment 294,466 287,115 294,737 255,615 195,991
Total revenue 826,530 737,223 707,690 635,560 533,624
Commissions 403,473 377,333 358,420 301,272 227,656
Net Revenue 423,057 359,890 349,270 334,288 305,968
Expenses 334,037 271,719 262,583 258,809 246,017
Income from continuing operations before income taxes 89,020 88,171 86,687 75,479 59,951
Income tax expense 23,891 12,485 11,923 4,385 (15,096)
Net income from continuing operations $ 65,129 $ 75,686 $ 74,764 $ 71,094 $ 75,047
Earnings per share from continuing operations: (1)
Basic $ 0.75 $ 0.87 $ 0.87 $ 0.83 $ 0.85
Diluted 0.75 0.87 0.86 0.82 0.83
Shares outstanding
Basic 86,916 86,223 86,178 85,503 88,802
Diluted 87,330 86,619 86,716 86,322 90,925
Financial Position
Unrestricted assets (2) $ 393,920 $ 373,036 $ 346,122 $ 240,710 $ 217,913
Restricted assets (2) 7,640,581 7,421,481 7,825,955 6,649,722 4,875,254
Total assets 8,630,735 9,222,154 9,675,430 8,375,301 6,551,492
Payment service obligations 7,640,581 7,421,481 7,825,955 6,649,722 4,875,254
Long-term debt (3) 150,000 201,351 294,879 322,670 361,323
Redeemable preferred stock (4) — 6,733 6,704 6,679 6,658
Stockholders' equity (5) 565,191 868,783 718,947 758,556 793,635
Other Selected Data
Capital expenditures $ 29,589 $ 27,128 $ 26,842 $ 32,225 $ 24,810
Depreciation and amortization 29,567 27,295 25,894 30,552 27,148
Cash dividends declared per share (6) 0.20 0.36 0.36 0.36 0.36
Average investable balances (7) 6,772,124 6,979,247 6,131,145 4,992,650 3,814,477
Net investment margin (8) 1.42% 1.30% 1.81% 1.96% 1.75%
Approximate number of countries served 170 160 155 152 150
Number of money order and money transfer locations 116,032 104,963 98,816 95,334 81,571
(1) Earnings per share for 2000 through 2003 is based on outstanding shares of Viad Corp common stock. On June 30, 2004, Viad effected a 1:1 distribution
of MoneyGram common stock, for a total distribution of 88,556,077 shares.
(2) Unrestricted and restricted assets are comprised of cash and cash equivalents, receivables and investments. See Note 2 of the Notes to Consolidated
Financial Statements for the determination of unrestricted assets. 10