MoneyGram 2004 Annual Report Download - page 26
Download and view the complete annual report
Please find page 26 of the 2004 MoneyGram annual report below. You can navigate through the pages in the report by either clicking on the pages listed below, or by using the keyword search tool below to find specific information within the annual report.-
 1
1 -
2
-
3
-
4
-
5
-
6
-
7
-
8
-
9
-
10
-
11
-
12
-
13
-
14
-
15
-
 16
16 -
 17
17 -
 18
18 -
 19
19 -
 20
20 -
 21
21 -
 22
22 -
 23
23 -
 24
24 -
 25
25 -
 26
26 -
 27
27 -
 28
28 -
 29
29 -
 30
30 -
 31
31 -
 32
32 -
 33
33 -
 34
34 -
 35
35 -
 36
36 -
37
-
38
-
39
-
40
-
41
-
42
-
43
-
44
-
45
-
46
-
47
-
48
-
49
-
50
-
51
-
52
-
53
-
54
-
55
-
56
-
57
-
58
-
59
-
60
-
61
-
62
-
63
-
64
-
65
-
66
-
67
-
68
-
69
-
70
-
71
-
72
-
73
-
74
-
75
-
76
-
77
-
78
-
79
-
80
-
81
-
82
-
83
-
84
-
85
-
86
-
87
-
88
-
89
-
90
-
91
-
92
-
93
 |
 |

Table of Contents
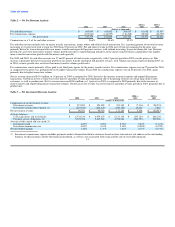
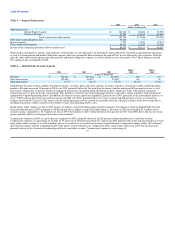
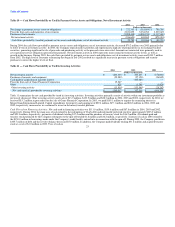
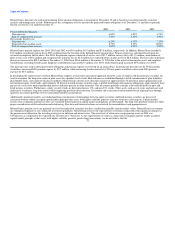
Table 10 — Cash Flows Provided By or Used In Payment Service Assets and Obligations, Net of Investment Activity
2004 2003 2002
(Dollars in thousands)
Net change in payment service assets or obligations $ 272,383 $ (361,899) $ 788,298
Proceeds from sales and maturities of investments 2,851,895 5,354,783 3,239,625
Purchases of investments (3,098,498) (4,888,918) (4,117,626)
Net investment activity (246,603) 465,865 (878,001)
Cash flows provided by (used in) payment service assets and obligations, net of investment activity $ 25,780 $ 103,966 $ (89,703)
During 2004, the cash flows provided by payment service assets and obligations, net of investment activity, decreased $78.2 million over 2003 primarily due
to lower levels of investment activity. In 2003, the Company repositioned its portfolio and experienced a high rate of prepayments on its mortgage-backed
securities, generating significant levels of proceeds and purchasing activity as the proceeds were reinvested. Amounts not reinvested were primarily used to
cover payment service obligations presented for payment. Net investment activity in 2004 represents more normal investment activity levels, as well as
growth in the business. During 2003, the cash flows provided by payment service assets and obligations, net of investment activity, increased $193.7 million
from 2002. The high level of consumer refinancing that began in late 2002 resulted in a significant increase in payment service obligations and security
purchases to invest the higher levels of float.
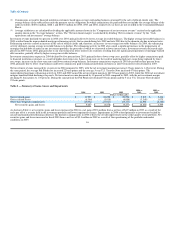
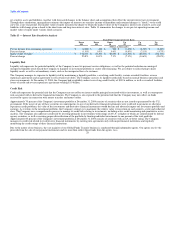
Table 11 — Cash Flows Provided By or Used In Investing Activities
2004 2003 2002
(Dollars in thousands)
Net investment activity $ (246,603) $ 465,865 $ (878,001)
Purchases of property and equipment (29,589) (27,128) (26,842)
Cash paid for acquisition of minority interest — (105,080) —
Proceeds from sale of Game Financial Corporation 15,247 — —
Other 428 (1,341) (1,420)
Other investing activity (13,914) (133,549) (28,262)
Net cash (used in) provided by investing activities $ (260,517) $ 332,316 $ (906,263)
Table 11 summarizes the net cash provided by (used in) investing activities. Investing activities primarily consist of activity within our investment portfolio as
previously discussed. Other investing activity used cash of $13.9 million, $133.5 million and $28.3 million in 2004, 2003 and 2002, respectively. In 2004, we
received $15.2 million in proceeds from the sale of Game Financial Corporation. In 2003, we paid $105.1 million to acquire the remaining interest in
MoneyGram International Limited. Capital expenditures for property and equipment of $29.6 million, $27.1 million and $26.8 million in 2004, 2003 and
2002, respectively, increased as we continued to invest in the money transfer platform.
Cash Flows from Financing Activities: Net cash used in financing activities was $111.0 million, $139.6 million and $87.8 million in 2004, 2003 and 2002,
respectively. During 2004, the main uses of cash related to the redemption of Viad's debt and redeemable preferred stock for approximately $203.0 million
and $23.9 million, respectively, payments of dividends totaling $17.4 million and the purchase of treasury stock for $16.2 million. (Dividends paid and
treasury stock purchased by the Company subsequent to the spin-off totaled $1.8 million and $16.2 million, respectively.) Sources of cash in 2004 related to
the $150.0 million in borrowings made under the Company's credit facility entered into in connection with the spin-off. During 2003, the Company paid down
$105.7 million of debt and the revolver balance decreased $5.0 million. In addition, the Company paid dividends totaling $31.6 million and acquired treasury
stock at a cost of $1.0 million in 2003. Uses of cash in 23