MoneyGram 2004 Annual Report Download - page 25
Download and view the complete annual report
Please find page 25 of the 2004 MoneyGram annual report below. You can navigate through the pages in the report by either clicking on the pages listed below, or by using the keyword search tool below to find specific information within the annual report.-
 1
1 -
2
-
3
-
4
-
5
-
6
-
7
-
8
-
9
-
10
-
11
-
12
-
13
-
14
-
 15
15 -
 16
16 -
 17
17 -
 18
18 -
 19
19 -
 20
20 -
 21
21 -
 22
22 -
 23
23 -
 24
24 -
 25
25 -
 26
26 -
 27
27 -
 28
28 -
 29
29 -
 30
30 -
 31
31 -
 32
32 -
 33
33 -
 34
34 -
 35
35 -
36
-
37
-
38
-
39
-
40
-
41
-
42
-
43
-
44
-
45
-
46
-
47
-
48
-
49
-
50
-
51
-
52
-
53
-
54
-
55
-
56
-
57
-
58
-
59
-
60
-
61
-
62
-
63
-
64
-
65
-
66
-
67
-
68
-
69
-
70
-
71
-
72
-
73
-
74
-
75
-
76
-
77
-
78
-
79
-
80
-
81
-
82
-
83
-
84
-
85
-
86
-
87
-
88
-
89
-
90
-
91
-
92
-
93
 |
 |

Table of Contents
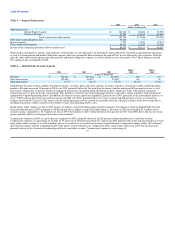
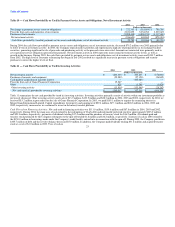
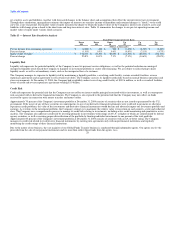
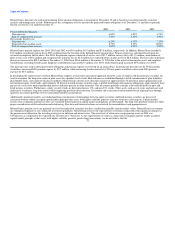
Table 8 — Unrestricted Assets
2004 2003
(Dollars in thousands)
Cash and cash equivalents $ 927,042 $ 1,025,026
Receivables, net 771,966 755,734
Investments 6,335,493 6,013,757
8,034,501 7,794,517
Amounts restricted to cover payment service obligations (7,640,581) (7,421,481)
Unrestricted assets $ 393,920 $ 373,036
Table 9 — Cash Flows Provided By or Used In Operating Activities
2004 2003 2002
(Dollars in thousands)
Net income $ 86,412 $ 113,902 $ 57,886
Total adjustments to reconcile net income 87,722 61,507 43,382
Net cash provided by continuing operating activities before changes in payment service assets and obligations 174,134 175,409 101,268
Change in cash and cash equivalents (substantially restricted) 75,937 286,364 (554,374)
Change in receivables, net (substantially restricted) (22,654) (243,789) 166,439
Change in payment service obligations 219,100 (404,474) 1,176,233
Net change in payment service assets and obligations 272,383 (361,899) 788,298
Net cash provided by (used in) continuing operating activities $ 446,517 $ (186,490) $ 889,566
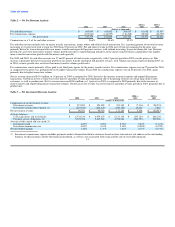
Table 9 summarizes the cash flows provided by (used in) continuing operating activities. Net cash provided by continuing operating activities before changes
in payment service assets and obligations was $174.1 million and $175.4 million for 2004 and 2003, respectively, for a decrease of $1.3 million. The decrease
is primarily due to the lower net income in 2004. We realized an increase of $74.1 million in 2003 compared to net cash provided by continuing operating
activities before changes in payment service assets and obligations of $101.3 million in 2002. This increase is primarily due to higher net income and the
timing of payment on accounts payable and other liabilities.
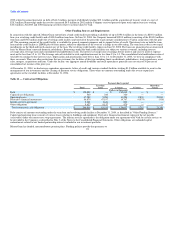
To understand the cash flow activity of our business, the cash provided by (used in) operating activities relating to the payment service assets and obligations
should be reviewed in conjunction with the related cash provided by (used in) investing activities related to our investment portfolio. Table 10 summarizes the
cash flows provided by or used by payment service assets and obligations, net of investment activity:
22