MoneyGram 2004 Annual Report Download - page 17
Download and view the complete annual report
Please find page 17 of the 2004 MoneyGram annual report below. You can navigate through the pages in the report by either clicking on the pages listed below, or by using the keyword search tool below to find specific information within the annual report.-
 1
1 -
2
-
3
-
4
-
5
-
6
-
 7
7 -
 8
8 -
 9
9 -
 10
10 -
 11
11 -
 12
12 -
 13
13 -
 14
14 -
 15
15 -
 16
16 -
 17
17 -
 18
18 -
 19
19 -
 20
20 -
 21
21 -
 22
22 -
 23
23 -
 24
24 -
 25
25 -
 26
26 -
 27
27 -
28
-
29
-
30
-
31
-
32
-
33
-
34
-
35
-
36
-
37
-
38
-
39
-
40
-
41
-
42
-
43
-
44
-
45
-
46
-
47
-
48
-
49
-
50
-
51
-
52
-
53
-
54
-
55
-
56
-
57
-
58
-
59
-
60
-
61
-
62
-
63
-
64
-
65
-
66
-
67
-
68
-
69
-
70
-
71
-
72
-
73
-
74
-
75
-
76
-
77
-
78
-
79
-
80
-
81
-
82
-
83
-
84
-
85
-
86
-
87
-
88
-
89
-
90
-
91
-
92
-
93
 |
 |

Table of Contents
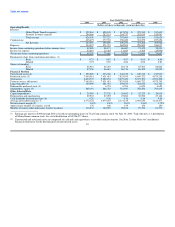
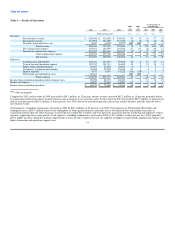
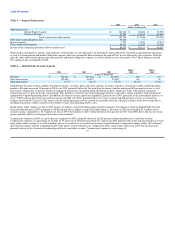
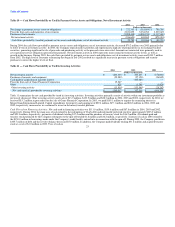
Table 1 — Results of Operations
As a Percentage of
2004 2003 Total Revenue
vs vs
2004 2003 2002 2003 2002 2004 2003 2002
(%)
(Dollars in thousands) (%) (%) (%) (%)
Revenue:
Fee and other revenue $ 500,940 $ 419,002 $ 365,635 20 15 61 57 52
Investment revenue 315,983 323,099 351,332 (2) (8) 38 44 50
Securities gains and losses, net 9,607 (4,878) (9,277) NM NM 1 (1) (1)
Total revenue 826,530 737,223 707,690 12 4 100 100 100
Fee commissions expense 183,561 144,997 118,268 27 23 22 20 17
Investment commissions expense 219,912 232,336 240,152 (5) (3) 27 32 34
Total commissions expense 403,473 377,333 358,420 7 5 49 51 51
Net revenue 423,057 359,890 349,270 18 3 51 49 49
Expenses:
Compensation and benefits 126,641 107,497 99,689 18 8 15 15 14
Transaction and operations support 120,767 101,513 96,608 19 5 15 14 14
Depreciation and amortization 29,567 27,295 25,894 8 5 4 4 4
Occupancy, equipment and supplies 30,828 25,557 25,180 21 1 4 3 4
Interest expense 5,573 9,857 15,212 (43) (35) 1 1 2
Debt tender and redemption costs 20,661 — — NM NM 2 — —
Total expenses 334,037 271,719 262,583 23 3 40 37 37
Income from continuing operations before income taxes 89,020 88,171 86,687 1 2 11 12 12
Income tax expense 23,891 12,485 11,923 91 5 3 2 2
Income from continuing operations $ 65,129 $ 75,686 $ 74,764 (14) 1 8 10 11
NM = Not meaningful
Compared to 2003, total revenue in 2004 increased by $89.3 million, or 12 percent, and net revenue increased $63.2 million, or 18 percent, primarily driven
by transaction growth in the money transfer business and an increase in net securities gains. Total revenue in 2003 increased by $29.5 million, or four percent,
and net revenue increased $10.6 million, or three percent, over 2002, driven by transaction growth in the money transfer business, partially offset by lower
investment revenue.
Total expenses, excluding commissions, increased in 2004 by $62.3 million, or 23 percent, over 2003. Total expenses in 2004 include debt tender and
redemption costs of $20.7 million related to the redemption of Viad's preferred shares and tender for its subordinated debt and medium term notes in
connection with the spin-off. Other increases to total expenses totaled $41.6 million and were driven by transaction growth, marketing and employee-related
expenses supporting our revenue growth. Total expenses, excluding commissions, increased in 2003 by $9.1 million, or three percent, over 2002, primarily
due to higher incentive and profit-sharing compensation as more incentive targets were met, the addition of employees and related compensation expense and
higher transaction and operations support costs. 14