Metro PCS 2009 Annual Report Download - page 97
Download and view the complete annual report
Please find page 97 of the 2009 Metro PCS annual report below. You can navigate through the pages in the report by either clicking on the pages listed below, or by using the keyword search tool below to find specific information within the annual report.-
 1
1 -
2
-
3
-
4
-
5
-
6
-
7
-
8
-
9
-
10
-
11
-
12
-
13
-
14
-
15
-
16
-
17
-
18
-
19
-
20
-
21
-
22
-
23
-
24
-
25
-
26
-
27
-
28
-
29
-
30
-
31
-
32
-
33
-
34
-
35
-
36
-
37
-
38
-
39
-
40
-
41
-
42
-
43
-
44
-
45
-
46
-
47
-
48
-
49
-
50
-
51
-
52
-
53
-
54
-
55
-
56
-
57
-
58
-
59
-
60
-
61
-
62
-
63
-
64
-
65
-
66
-
67
-
68
-
69
-
70
-
71
-
72
-
73
-
74
-
75
-
76
-
77
-
78
-
79
-
80
-
81
-
82
-
83
-
84
-
85
-
86
-
 87
87 -
 88
88 -
 89
89 -
 90
90 -
 91
91 -
 92
92 -
 93
93 -
 94
94 -
 95
95 -
 96
96 -
 97
97 -
 98
98 -
 99
99 -
 100
100 -
 101
101 -
 102
102 -
 103
103 -
 104
104 -
 105
105 -
 106
106 -
 107
107 -
108
-
109
-
110
-
111
-
112
-
113
-
114
-
115
-
116
-
117
-
118
-
119
-
120
-
121
-
122
-
123
-
124
-
125
-
126
-
127
-
128
-
129
-
130
-
131
-
132
-
133
-
134
-
135
-
136
-
137
-
138
-
139
-
140
-
141
-
142
-
143
-
144
-
145
-
146
-
147
-
148
-
149
-
150
-
151
-
152
-
153
-
154
-
155
-
156
-
157
-
158
-
159
-
160
-
161
-
162
-
163
-
164
 |
 |

85
Year Ended December 31,
2009 2008 2007
(In thousands, except average number of customers and
CPU)
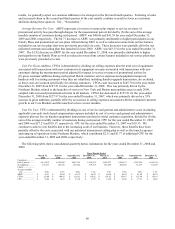
Calculation of Cost Per User (CPU):
Cost of service ........................................................................................ $ 1,120,052 $ 857,295 $ 647,510
Add: General and administrative expenses .......................................... 265,455 235,289 198,955
Add: Net loss on equipment transactions unrelated to initial
customer acquisition............................................................................ 105,864 95,282 49,331
Less: Stock-based compensation expense included in cost of
service and general and administrative expense .................................. (47,783) (41,142) (28,024)
Less: Pass through charges .................................................................. (173,099) (136,801) (95,946)
Total costs used in the calculation of CPU ............................................. $ 1,270,489 $ 1,009,923 $ 771,826
Divided by: Average number of customers ............................................ 6,145,414 4,631,168 3,508,497
CPU ........................................................................................................ $ 17.23 $ 18.17 $ 18.33
Three Months Ended
March 31,
2008
June 30,
2008
September 30,
2008
December 31,
2008
(In thousands, except average number of customers and CPU)
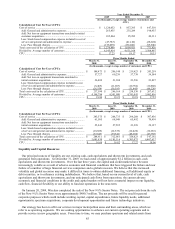
Calculation of Cost Per User (CPU):
Cost of service ......................................................................... $ 188,473 $ 206,140 $ 219,423 $ 243,259
Add: General and administrative expenses ........................... 57,727 60,239 57,738 59,584
Add: Net loss on equipment transactions unrelated to
initial customer acquisition................................................... 26,409 21,380 23,596 23,897
Less: Stock-based compensation expense included in cost
of service and general and administrative expense ............... (8,465) (11,007) (10,782) (10,888)
Less: Pass through charges ................................................... (26,554) (30,583) (31,445) (48,220)
Total costs used in the calculation of CPU .............................. $ 237,590 $ 246,169 $ 258,530 $ 267,632
Divided by: Average number of customers ............................. 4,198,794 4,501,980 4,741,043 5,082,856
CPU ......................................................................................... $ 18.86 $ 18.23 $ 18.18 $ 17.55
Three Months Ended
March 31,
2009
June 30,
2009
September 30,
2009
December 31,
2009
(In thousands, except average number of customers and CPU)
Calculation of Cost Per User (CPU):
Cost of service ......................................................................... $ 245,575 $ 268,733 $ 298,288 $ 307,456
Add: General and administrative expenses ........................... 61,505 68,049 65,492 70,410
Add: Net loss on equipment transactions unrelated to
initial customer acquisition................................................... 25,843 27,595 23,299 29,127
Less: Stock-based compensation expense included in cost
of service and general and administrative expense ............... (10,669) (12,673) (12,426) (12,016)
Less: Pass through charges ................................................... (37,643) (39,641) (48,030) (47,785)
Total costs used in the calculation of CPU .............................. $ 284,611 $ 312,063 $ 326,623 $ 347,192
Divided by: Average number of customers ............................. 5,685,830 6,185,116 6,303,075 6,407,637
CPU ......................................................................................... $ 16.69 $ 16.82 $ 17.27 $ 18.06
Liquidity and Capital Resources
Our principal sources of liquidity are our existing cash, cash equivalents and short-term investments, and cash
generated from operations. At December 31, 2009, we had a total of approximately $1.2 billion in cash, cash
equivalents and short-term investments. Over the last three years, the capital and credit markets have become
increasingly volatile as a result of adverse economic and financial conditions that have triggered the failure and near
failure of a number of large financial services companies and a global recession. We believe that this increased
volatility and global recession may make it difficult at times to obtain additional financing, sell additional equity or
debt securities, or to refinance existing indebtedness. We believe that, based on our current level of cash, cash
equivalents and short-term investments, and our anticipated cash flows from operations, the current adverse
economic and financial conditions in the credit and capital markets will not have a material impact on our liquidity,
cash flow, financial flexibility or our ability to fund our operations in the near-term.
On January 20, 2009, Wireless completed the sale of the New 9¼% Senior Notes. The net proceeds from the sale
of the New 9¼% Senior Notes were approximately $480.3 million. The net proceeds will be used for general
corporate purposes which could include working capital, capital expenditures, future liquidity needs, additional
opportunistic spectrum acquisitions, corporate development opportunities and future technology initiatives.
Our strategy has been to offer our services in major metropolitan areas and their surrounding areas, which we
refer to as operating segments. We are seeking opportunities to enhance our current operating segments and to
provide service in new geographic areas. From time to time, we may purchase spectrum and related assets from