Metro PCS 2009 Annual Report Download - page 117
Download and view the complete annual report
Please find page 117 of the 2009 Metro PCS annual report below. You can navigate through the pages in the report by either clicking on the pages listed below, or by using the keyword search tool below to find specific information within the annual report.-
 1
1 -
2
-
3
-
4
-
5
-
6
-
7
-
8
-
9
-
10
-
11
-
12
-
13
-
14
-
15
-
16
-
17
-
18
-
19
-
20
-
21
-
22
-
23
-
24
-
25
-
26
-
27
-
28
-
29
-
30
-
31
-
32
-
33
-
34
-
35
-
36
-
37
-
38
-
39
-
40
-
41
-
42
-
43
-
44
-
45
-
46
-
47
-
48
-
49
-
50
-
51
-
52
-
53
-
54
-
55
-
56
-
57
-
58
-
59
-
60
-
61
-
62
-
63
-
64
-
65
-
66
-
67
-
68
-
69
-
70
-
71
-
72
-
73
-
74
-
75
-
76
-
77
-
78
-
79
-
80
-
81
-
82
-
83
-
84
-
85
-
86
-
87
-
88
-
89
-
90
-
91
-
92
-
93
-
94
-
95
-
96
-
97
-
98
-
99
-
100
-
101
-
102
-
103
-
104
-
105
-
106
-
 107
107 -
 108
108 -
 109
109 -
 110
110 -
 111
111 -
 112
112 -
 113
113 -
 114
114 -
 115
115 -
 116
116 -
 117
117 -
 118
118 -
 119
119 -
 120
120 -
 121
121 -
 122
122 -
 123
123 -
 124
124 -
 125
125 -
 126
126 -
 127
127 -
128
-
129
-
130
-
131
-
132
-
133
-
134
-
135
-
136
-
137
-
138
-
139
-
140
-
141
-
142
-
143
-
144
-
145
-
146
-
147
-
148
-
149
-
150
-
151
-
152
-
153
-
154
-
155
-
156
-
157
-
158
-
159
-
160
-
161
-
162
-
163
-
164
 |
 |

F-3
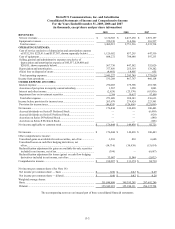
MetroPCS Communications, Inc. and Subsidiaries
Consolidated Statements of Income and Comprehensive Income
For the Years Ended December 31, 2009, 2008 and 2007
(in thousands, except share and per share information)
2009 2008 2007
REVENUES:
Service revenues .................................................................................... $ 3,130,385 $ 2,437,250 $ 1,919,197
Equipment revenues............................................................................... 350,130 314,266 316,537
Total revenues....................................................................................... 3,480,515 2,751,516 2,235,734
OPERATING EXPENSES:
Cost of service (exclusive of depreciation and amortization expense
of $332,319, $225,911 and $157,387, shown separately below) ......... 1,120,052 857,295 647,510
Cost of equipment.................................................................................. 884,272 704,648 597,233
Selling, general and administrative expenses (exclusive of
depreciation and amortization expense of $45,537, $29,408 and
$20,815, shown separately below)....................................................... 567,730 447,582 352,020
Depreciation and amortization............................................................... 377,856 255,319 178,202
(Gain) loss on disposal of assets ............................................................ (4,683) 18,905 655
Total operating expenses....................................................................... 2,945,227 2,283,749 1,775,620
Income from operations.......................................................................... 535,288 467,767 460,114
OTHER EXPENSE (INCOME):
Interest expense ..................................................................................... 270,285 179,398 201,746
Accretion of put option in majority-owned subsidiary........................... 1,567 1,258 1,003
Interest and other income....................................................................... (2,629) (23,170) (63,936)
Impairment loss on investment securities .............................................. 2,386 30,857 97,800
Total other expense............................................................................... 271,609 188,343 236,613
Income before provision for income taxes.............................................. 263,679 279,424 223,501
Provision for income taxes..................................................................... (86,835) (129,986) (123,098)
Net income.............................................................................................. 176,844 149,438 100,403
Accrued dividends on Series D Preferred Stock .................................... — — (6,499)
Accrued dividends on Series E Preferred Stock..................................... — — (929)
Accretion on Series D Preferred Stock .................................................. — — (148)
Accretion on Series E Preferred Stock................................................... — — (106)
Net income applicable to common stock ................................................ $ 176,844 $ 149,438 $ 92,721
Net income.............................................................................................. $ 176,844 $ 149,438 $ 100,403
Other comprehensive income:
Unrealized gains on available-for-sale securities, net of tax.................. 3,210 830 6,640
Unrealized losses on cash flow hedging derivatives, net
of tax.................................................................................................... (14,710) (30,438) (13,614)
Reclassification adjustment for gains on available-for-sale securities
included in net income, net of tax........................................................ (394) — (6,687)
Reclassification adjustment for losses (gains) on cash flow hedging
derivatives included in net income, net of tax ..................................... 33,087 11,544 (2,032)
Comprehensive income........................................................................... $ 198,037 $ 131,374 $ 84,710
Net income per common share: (See Note 16)
Net income per common share — basic ................................................ $ 0.50 $ 0.43 $ 0.29
Net income per common share — diluted.............................................. $ 0.49 $ 0.42 $ 0.28
Weighted average shares:
Basic ...................................................................................................... 351,898,898 349,395,285 287,692,280
Diluted ................................................................................................... 355,942,921 355,380,111 296,337,724
The accompanying notes are an integral part of these consolidated financial statements.