Metro PCS 2009 Annual Report Download - page 96
Download and view the complete annual report
Please find page 96 of the 2009 Metro PCS annual report below. You can navigate through the pages in the report by either clicking on the pages listed below, or by using the keyword search tool below to find specific information within the annual report.-
 1
1 -
2
-
3
-
4
-
5
-
6
-
7
-
8
-
9
-
10
-
11
-
12
-
13
-
14
-
15
-
16
-
17
-
18
-
19
-
20
-
21
-
22
-
23
-
24
-
25
-
26
-
27
-
28
-
29
-
30
-
31
-
32
-
33
-
34
-
35
-
36
-
37
-
38
-
39
-
40
-
41
-
42
-
43
-
44
-
45
-
46
-
47
-
48
-
49
-
50
-
51
-
52
-
53
-
54
-
55
-
56
-
57
-
58
-
59
-
60
-
61
-
62
-
63
-
64
-
65
-
66
-
67
-
68
-
69
-
70
-
71
-
72
-
73
-
74
-
75
-
76
-
77
-
78
-
79
-
80
-
81
-
82
-
83
-
84
-
85
-
 86
86 -
 87
87 -
 88
88 -
 89
89 -
 90
90 -
 91
91 -
 92
92 -
 93
93 -
 94
94 -
 95
95 -
 96
96 -
 97
97 -
 98
98 -
 99
99 -
 100
100 -
 101
101 -
 102
102 -
 103
103 -
 104
104 -
 105
105 -
 106
106 -
107
-
108
-
109
-
110
-
111
-
112
-
113
-
114
-
115
-
116
-
117
-
118
-
119
-
120
-
121
-
122
-
123
-
124
-
125
-
126
-
127
-
128
-
129
-
130
-
131
-
132
-
133
-
134
-
135
-
136
-
137
-
138
-
139
-
140
-
141
-
142
-
143
-
144
-
145
-
146
-
147
-
148
-
149
-
150
-
151
-
152
-
153
-
154
-
155
-
156
-
157
-
158
-
159
-
160
-
161
-
162
-
163
-
164
 |
 |

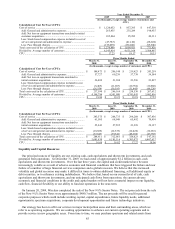
84
Year Ended December 31,
2009 2008 2007
(In thousands, except gross customer additions and
CPGA)
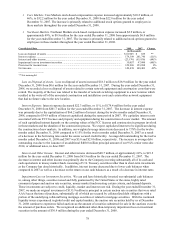
Calculation of Cost Per Gross Addition (CPGA):
Selling expenses .........................................................................................
.
$ 302,275 $ 212,293 $ 153,065
Less: Equipment revenues .......................................................................
.
(350,130) (314,266) (316,537)
Add: Impact to service revenues of promotional activity ........................
.
42,931 — —
Add: Equipment revenue not associated with new customers .................
.
169,929 149,029 142,822
Add: Cost of equipment...........................................................................
.
884,272 704,648 597,233
Less: Equipment costs not associated with new customers .....................
.
(275,793) (244,311) (192,153)
Gross addition expenses..............................................................................
.
$ 773,484 $ 507,393 $ 384,430
Divided by: Gross customer additions........................................................
.
5,305,505 3,988,692 3,004,177
CPGA .........................................................................................................
.
$ 145.79 $ 127.21 $ 127.97
Three Months Ended
March 31,
2008
June 30,
2008
September 30,
2008
December 31,
2008
(In thousands, except gross customer additions and CPGA)
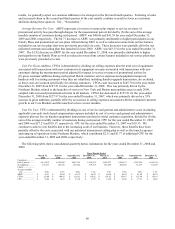
Calculation of Cost Per Gross Addition (CPGA):
Selling expenses .......................................................................... $ 46,647 $ 53,180 $ 58,916 $ 53,551
Less: Equipment revenues ........................................................ (100,384) (80,245) (76,030) (57,606)
Add: Equipment revenue not associated with new
customers................................................................................ 45,803 37,613 33,295 32,318
Add: Cost of equipment............................................................ 200,158 160,088 160,538 183,864
Less: Equipment costs not associated with new customers ...... (72,212) (58,993) (56,891) (56,215)
Gross addition expenses............................................................... $ 120,012 $ 111,643 $ 119,828 $ 155,912
Divided by: Gross customer additions......................................... 960,083 792,823 934,607 1,301,179
CPGA .......................................................................................... $ 125.00 $ 140.82 $ 128.21 $ 119.82
Three Months Ended
March 31,
2009
June 30,
2009
September 30,
2009
December 31,
2009
(In thousands, except gross customer additions and CPGA)
Calculation of Cost Per Gross Addition (CPGA):
Selling expenses ...................................................................... $ 74,906 $ 74,272 $ 72,968 $ 80,129
Less: Equipment revenues.................................................... (68,631) (92,762) (83,253) (105,484)
Add: Impact to service revenues of promotional activity ..... — 24,728 12,481 5,721
Add: Equipment revenue not associated with new
customers............................................................................ 41,215 41,829 38,742 48,143
Add: Cost of equipment........................................................ 225,018 227,400 199,092 232,762
Less: Equipment costs not associated with new
customers............................................................................ (67,058) (69,424) (62,041) (77,270)
Gross addition expenses........................................................... $ 205,450 $ 206,043 $ 177,989 $ 184,001
Divided by: Gross customer additions..................................... 1,530,565 1,288,818 1,156,242 1,329,880
CPGA ...................................................................................... $ 134.23 $ 159.87 $ 153.94 $ 138.36
CPU — We utilize CPU as a tool to evaluate the non-selling cash expenses associated with ongoing business
operations on a per customer basis, to track changes in these non-selling cash costs over time, and to help evaluate
how changes in our business operations affect non-selling cash costs per customer. In addition, CPU provides
management with a useful measure to compare our non-selling cash costs per customer with those of other wireless
providers. We believe investors use CPU primarily as a tool to track changes in our non-selling cash costs over time
and to compare our non-selling cash costs to those of other wireless providers, although other wireless carriers may
calculate this measure differently. The following table reconciles total costs used in the calculation of CPU to cost of
service, which we consider to be the most directly comparable GAAP financial measure to CPU.