Metro PCS 2009 Annual Report Download - page 136
Download and view the complete annual report
Please find page 136 of the 2009 Metro PCS annual report below. You can navigate through the pages in the report by either clicking on the pages listed below, or by using the keyword search tool below to find specific information within the annual report.-
 1
1 -
2
-
3
-
4
-
5
-
6
-
7
-
8
-
9
-
10
-
11
-
12
-
13
-
14
-
15
-
16
-
17
-
18
-
19
-
20
-
21
-
22
-
23
-
24
-
25
-
26
-
27
-
28
-
29
-
30
-
31
-
32
-
33
-
34
-
35
-
36
-
37
-
38
-
39
-
40
-
41
-
42
-
43
-
44
-
45
-
46
-
47
-
48
-
49
-
50
-
51
-
52
-
53
-
54
-
55
-
56
-
57
-
58
-
59
-
60
-
61
-
62
-
63
-
64
-
65
-
66
-
67
-
68
-
69
-
70
-
71
-
72
-
73
-
74
-
75
-
76
-
77
-
78
-
79
-
80
-
81
-
82
-
83
-
84
-
85
-
86
-
87
-
88
-
89
-
90
-
91
-
92
-
93
-
94
-
95
-
96
-
97
-
98
-
99
-
100
-
101
-
102
-
103
-
104
-
105
-
106
-
107
-
108
-
109
-
110
-
111
-
112
-
113
-
114
-
115
-
116
-
117
-
118
-
119
-
120
-
121
-
122
-
123
-
124
-
125
-
 126
126 -
 127
127 -
 128
128 -
 129
129 -
 130
130 -
 131
131 -
 132
132 -
 133
133 -
 134
134 -
 135
135 -
 136
136 -
 137
137 -
 138
138 -
 139
139 -
 140
140 -
 141
141 -
 142
142 -
 143
143 -
 144
144 -
 145
145 -
 146
146 -
147
-
148
-
149
-
150
-
151
-
152
-
153
-
154
-
155
-
156
-
157
-
158
-
159
-
160
-
161
-
162
-
163
-
164
 |
 |

MetroPCS Communications, Inc. and Subsidiaries
Notes to Consolidated Financial Statements
December 31, 2009, 2008 and 2007
F-22
Although the Company has determined the estimated fair value amounts using available market information and
commonly accepted valuation methodologies, considerable judgment is required in interpreting market data to
develop fair value estimates. The fair value estimates are based on information available at December 31, 2009 and
December 31, 2008 and have not been revalued since those dates. As such, the Company’s estimates are not
necessarily indicative of the amount that the Company, or holders of the instruments, could realize in a current
market exchange and current estimates of fair value could differ significantly.
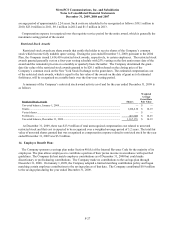
10. Concentrations:
The Company purchases a substantial portion of its wireless infrastructure equipment and handset equipment
from only a few major suppliers. Further, the Company generally relies on one or two key vendors in each of the
following areas: network infrastructure equipment, billing services, customer care, handset logistics and long
distance services. Loss of any of these suppliers could adversely affect operations temporarily until a comparable
substitute could be found.
Local and long distance telephone and other companies provide certain communication services to the Company.
Disruption of these services could adversely affect operations in the short term until an alternative
telecommunication provider was found.
Concentrations of credit risk with respect to trade accounts receivable are limited due to the diversity of the
Company’s indirect retailer base.
11. Commitments and Contingencies:
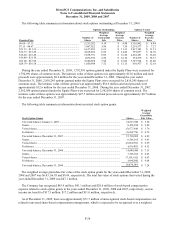
The Company has entered into pricing agreements with various handset manufacturers for the purchase of
wireless handsets at specified prices. The terms of these agreements expire on various dates through April 3, 2010.
The total aggregate commitment outstanding under these pricing agreements is approximately $17.2 million as of
December 31, 2009.
Operating and Capital Leases
The Company has entered into non-cancelable operating lease agreements to lease facilities, certain equipment
and sites for towers and antennas required for the operation of its wireless networks. Total rent expense for the years
ended December 31, 2009, 2008 and 2007 was $281.2 million, $199.1 million and $125.1 million, respectively.
The Company entered into various non-cancelable distributed antenna systems (“DAS”) capital lease agreements,
with varying expiration terms through 2025, covering dedicated optical fiber.
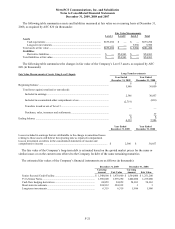
Future annual minimum rental payments required for all non-cancelable operating and capital leases at
December 31, 2009 are as follows (in thousands):
Operating Leases Capital Leases
For the Year Ending December 31,
2010...........................................................................................................................
.
$ 271,374 $ 20,363
2011...........................................................................................................................
.
273,098 20,265
2012...........................................................................................................................
.
263,994 20,872
2013...........................................................................................................................
.
266,428 21,499
2014...........................................................................................................................
.
264,868 22,144
Thereafter ..................................................................................................................
.
893,138 232,985
Total minimum future lease payments.......................................................................
.
$ 2,232,900 338,128
Amount representing interest.....................................................................................
.
(156,934)
Present value of minimum lease payments................................................................
.
181,194
Current portion ..........................................................................................................
.
(3,326)
Long-term capital lease obligations...........................................................................
.
$ 177,868