Metro PCS 2009 Annual Report Download - page 81
Download and view the complete annual report
Please find page 81 of the 2009 Metro PCS annual report below. You can navigate through the pages in the report by either clicking on the pages listed below, or by using the keyword search tool below to find specific information within the annual report.-
 1
1 -
2
-
3
-
4
-
5
-
6
-
7
-
8
-
9
-
10
-
11
-
12
-
13
-
14
-
15
-
16
-
17
-
18
-
19
-
20
-
21
-
22
-
23
-
24
-
25
-
26
-
27
-
28
-
29
-
30
-
31
-
32
-
33
-
34
-
35
-
36
-
37
-
38
-
39
-
40
-
41
-
42
-
43
-
44
-
45
-
46
-
47
-
48
-
49
-
50
-
51
-
52
-
53
-
54
-
55
-
56
-
57
-
58
-
59
-
60
-
61
-
62
-
63
-
64
-
65
-
66
-
67
-
68
-
69
-
70
-
 71
71 -
 72
72 -
 73
73 -
 74
74 -
 75
75 -
 76
76 -
 77
77 -
 78
78 -
 79
79 -
 80
80 -
 81
81 -
 82
82 -
 83
83 -
 84
84 -
 85
85 -
 86
86 -
 87
87 -
 88
88 -
 89
89 -
 90
90 -
 91
91 -
92
-
93
-
94
-
95
-
96
-
97
-
98
-
99
-
100
-
101
-
102
-
103
-
104
-
105
-
106
-
107
-
108
-
109
-
110
-
111
-
112
-
113
-
114
-
115
-
116
-
117
-
118
-
119
-
120
-
121
-
122
-
123
-
124
-
125
-
126
-
127
-
128
-
129
-
130
-
131
-
132
-
133
-
134
-
135
-
136
-
137
-
138
-
139
-
140
-
141
-
142
-
143
-
144
-
145
-
146
-
147
-
148
-
149
-
150
-
151
-
152
-
153
-
154
-
155
-
156
-
157
-
158
-
159
-
160
-
161
-
162
-
163
-
164
 |
 |
69
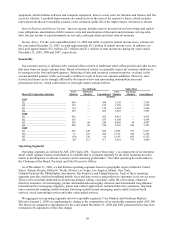
•Core Markets, which include Atlanta, Dallas/Ft. Worth, Detroit, Las Vegas, Los Angeles, Miami,
Orlando/Jacksonville, Sacramento, San Francisco and Tampa/Sarasota, are aggregated because they are
reviewed on an aggregate basis by the chief operating decision maker, they are similar in respect to their
products and services, production processes, class of customer, method of distribution, and regulatory
environment and currently exhibit similar financial performance and economic characteristics.
•Northeast Markets, which include Boston, New York and Philadelphia, are aggregated because they are
reviewed on an aggregate basis by the chief operating decision maker, they are similar in respect to their
products and services, production processes, class of customer, method of distribution, and regulatory
environment and have similar expected long-term financial performance and economic characteristics.
General corporate overhead, which includes expenses such as corporate employee labor costs, rent and utilities,
legal, accounting and auditing expenses, is allocated equally across all operating segments. Corporate marketing
and advertising expenses are allocated equally to the operating segments, beginning in the period during which we
launch service in that operating segment. Expenses associated with our national data center and national operations
center are allocated based on the average number of customers in each operating segment. There are no transactions
between reportable segments.
Interest and certain other expenses, interest income and income taxes are not allocated to the segments in the
computation of segment operating profit for internal evaluation purposes.