Metro PCS 2009 Annual Report Download - page 80
Download and view the complete annual report
Please find page 80 of the 2009 Metro PCS annual report below. You can navigate through the pages in the report by either clicking on the pages listed below, or by using the keyword search tool below to find specific information within the annual report.-
 1
1 -
2
-
3
-
4
-
5
-
6
-
7
-
8
-
9
-
10
-
11
-
12
-
13
-
14
-
15
-
16
-
17
-
18
-
19
-
20
-
21
-
22
-
23
-
24
-
25
-
26
-
27
-
28
-
29
-
30
-
31
-
32
-
33
-
34
-
35
-
36
-
37
-
38
-
39
-
40
-
41
-
42
-
43
-
44
-
45
-
46
-
47
-
48
-
49
-
50
-
51
-
52
-
53
-
54
-
55
-
56
-
57
-
58
-
59
-
60
-
61
-
62
-
63
-
64
-
65
-
66
-
67
-
68
-
69
-
 70
70 -
 71
71 -
 72
72 -
 73
73 -
 74
74 -
 75
75 -
 76
76 -
 77
77 -
 78
78 -
 79
79 -
 80
80 -
 81
81 -
 82
82 -
 83
83 -
 84
84 -
 85
85 -
 86
86 -
 87
87 -
 88
88 -
 89
89 -
 90
90 -
91
-
92
-
93
-
94
-
95
-
96
-
97
-
98
-
99
-
100
-
101
-
102
-
103
-
104
-
105
-
106
-
107
-
108
-
109
-
110
-
111
-
112
-
113
-
114
-
115
-
116
-
117
-
118
-
119
-
120
-
121
-
122
-
123
-
124
-
125
-
126
-
127
-
128
-
129
-
130
-
131
-
132
-
133
-
134
-
135
-
136
-
137
-
138
-
139
-
140
-
141
-
142
-
143
-
144
-
145
-
146
-
147
-
148
-
149
-
150
-
151
-
152
-
153
-
154
-
155
-
156
-
157
-
158
-
159
-
160
-
161
-
162
-
163
-
164
 |
 |

68
equipment, which includes software and computer equipment, three to seven years for furniture and fixtures and five
years for vehicles. Leasehold improvements are amortized over the term of the respective leases, which includes
renewal periods that are reasonably assured, or the estimated useful life of the improvement, whichever is shorter.
Interest Expense and Interest Income. Interest expense includes interest incurred on our borrowings and capital
lease obligations, amortization of debt issuance costs and amortization of discounts and premiums on long-term
debt. Interest income is earned primarily on our cash, cash equivalents and short term investments.
Income Taxes. For the years ended December 31, 2009 and 2008, we paid no federal income taxes, whereas for
the year ended December 31, 2007, we paid approximately $0.3 million in federal income taxes. In addition, we
have paid approximately $3.1 million, $2.7 million and $1.1 million of state income tax during the years ended
December 31, 2009, 2008 and 2007, respectively.
Seasonality
Our customer activity is influenced by seasonal effects related to traditional retail selling periods and other factors
that arise from our target customer base. Based on historical results, we generally expect net customer additions to
be strongest in the first and fourth quarters. Softening of sales and increased customer turnover, or churn, in the
second and third quarters of the year usually combine to result in fewer net customer additions. However, sales
activity and churn can be strongly affected by the launch of new and surrounding metropolitan areas and
promotional activity, which could reduce or outweigh certain seasonal effects.
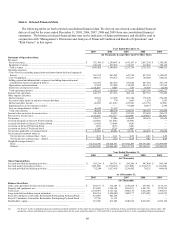
Net Additions
Subscribers
MetroPCS Subscriber Statistics
Core
Markets
Northeast
Markets Consolidated
Core
Markets
Northeast
Markets Consolidated
(In 000s)
2007
Q1............................................................ 454 — 454 3,395 — 3,395
Q2............................................................ 155 — 155 3,550 — 3,550
Q3............................................................ 114 — 114 3,664 — 3,664
Q4............................................................ 299 — 299 3,963 — 3,963
2008
Q1............................................................ 452 — 452 4,415 — 4,415
Q2............................................................ 183 — 183 4,598 — 4,598
Q3............................................................ 205 44 249 4,803 44 4,847
Q4............................................................ 460 60 520 5,263 104 5,367
2009
Q1............................................................ 435 249 684 5,698 353 6,051
Q2............................................................ 13 193 206 5,710 546 6,256
Q3............................................................ (54) 120 66 5,656 666 6,322
Q4............................................................ 205 112 317 5,861 779 6,640
Operating Segments
Operating segments are defined by ASC 280 (Topic 280, “Segment Reporting”), as components of an enterprise
about which separate financial information is available that is evaluated regularly by the chief operating decision
maker in deciding how to allocate resources and in assessing performance. Our chief operating decision maker is
the Chairman of the Board, President and Chief Executive Officer.
As of December 31, 2009, we had thirteen operating segments based on geographic region within the United
States: Atlanta, Boston, Dallas/Ft. Worth, Detroit, Las Vegas, Los Angeles, Miami, New York,
Orlando/Jacksonville, Philadelphia, Sacramento, San Francisco and Tampa/Sarasota. Each of these operating
segments provides wireless broadband mobile voice and data services and products to customers in its service areas.
These services include unlimited local and long distance calling, voicemail, caller ID, call waiting, enhanced
directory assistance, text messaging, picture and multimedia messaging, domestic and international long distance,
international text messaging, ringtones, games and content applications, unlimited directory assistance, ring back
tones, nationwide roaming, mobile Internet browsing, mobile instant messaging, push e-mail, location based
services, social networking services and other value-added services.
We aggregate our operating segments into two reportable segments: Core Markets and Northeast Markets.
Effective January 1, 2009, we implemented a change to the composition of our reportable segments under ASC 280.
The historical comparative information for the years ended December 31, 2008 and 2007 presented below has been
retrospectively adjusted to reflect this change.