Metro PCS 2009 Annual Report Download - page 93
Download and view the complete annual report
Please find page 93 of the 2009 Metro PCS annual report below. You can navigate through the pages in the report by either clicking on the pages listed below, or by using the keyword search tool below to find specific information within the annual report.-
 1
1 -
2
-
3
-
4
-
5
-
6
-
7
-
8
-
9
-
10
-
11
-
12
-
13
-
14
-
15
-
16
-
17
-
18
-
19
-
20
-
21
-
22
-
23
-
24
-
25
-
26
-
27
-
28
-
29
-
30
-
31
-
32
-
33
-
34
-
35
-
36
-
37
-
38
-
39
-
40
-
41
-
42
-
43
-
44
-
45
-
46
-
47
-
48
-
49
-
50
-
51
-
52
-
53
-
54
-
55
-
56
-
57
-
58
-
59
-
60
-
61
-
62
-
63
-
64
-
65
-
66
-
67
-
68
-
69
-
70
-
71
-
72
-
73
-
74
-
75
-
76
-
77
-
78
-
79
-
80
-
81
-
82
-
 83
83 -
 84
84 -
 85
85 -
 86
86 -
 87
87 -
 88
88 -
 89
89 -
 90
90 -
 91
91 -
 92
92 -
 93
93 -
 94
94 -
 95
95 -
 96
96 -
 97
97 -
 98
98 -
 99
99 -
 100
100 -
 101
101 -
 102
102 -
 103
103 -
104
-
105
-
106
-
107
-
108
-
109
-
110
-
111
-
112
-
113
-
114
-
115
-
116
-
117
-
118
-
119
-
120
-
121
-
122
-
123
-
124
-
125
-
126
-
127
-
128
-
129
-
130
-
131
-
132
-
133
-
134
-
135
-
136
-
137
-
138
-
139
-
140
-
141
-
142
-
143
-
144
-
145
-
146
-
147
-
148
-
149
-
150
-
151
-
152
-
153
-
154
-
155
-
156
-
157
-
158
-
159
-
160
-
161
-
162
-
163
-
164
 |
 |

81
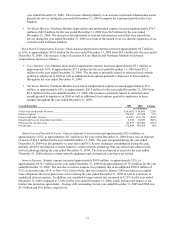
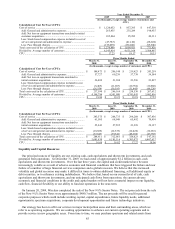
Core Markets Performance Measures
Set forth below is a summary of certain key performance measures for the periods indicated for our Core
Markets:
Year Ended December 31,
2009 2008 2007
(Dollars in thousands)
Core Markets Customers:
End of period ..........................................................................................................
.
5,860,613 5,262,682 3,962,786
Net additions...........................................................................................................
.
597,931 1,299,896 1,021,800
Core Markets Adjusted EBITDA.............................................................................
.
$ 1,161,485 $ 901,751 $ 694,761
Core Markets Adjusted EBITDA as a Percent of Service Revenues .......................
.
40.1% 37.2% 36.2%
As of December 31, 2009, our networks in our Core Markets cover a population of approximately 65 million.
Customers. Net customer additions in our Core Markets were 597,931 for the year ended December 31, 2009,
compared to 1,299,896 for the year ended December 31, 2008. The decrease in net customer additions is primarily
attributable to the maturation of our Core Markets, current economic conditions and increased competition. Total
customers were 5,860,613 as of December 31, 2009, an increase of 11% over the customer total as of December 31,
2008. Net customer additions in our Core Markets were 1,299,896 for the year ended December 31, 2008, bringing
our total customers to 5,262,682 as of December 31, 2008, an increase of approximately 33% over the total
customers as of December 31, 2007. The increase in total customers is primarily attributable to the continued
demand for our service offerings.
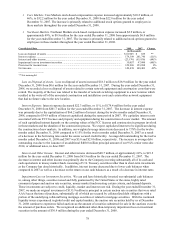
Segment Adjusted EBITDA. Segment Adjusted EBITDA is presented in accordance with ASC 280 as it is the
primary performance metric for which our reportable segments are evaluated and it is utilized by management to
facilitate evaluation of our ability to meet future debt service, capital expenditures and working capital requirements
and to fund future growth. For the year ended December 31, 2009, Core Markets Adjusted EBITDA was
approximately $1.2 billion compared to approximately $901.8 million for the year ended December 31, 2008. For
the year ended December 31, 2007, Core Markets Adjusted EBITDA was approximately $694.8 million. We
continue to experience increases in Core Markets Adjusted EBITDA as a result of continued customer growth and
cost benefits due to the increasing scale of our business in the Core Markets.
Segment Adjusted EBITDA as a Percent of Service Revenues. Segment Adjusted EBITDA as a percent of service
revenues is calculated by dividing Segment Adjusted EBITDA by total service revenues. Core Markets Adjusted
EBITDA as a percent of service revenues for the year ended December 31, 2009, 2008 and 2007 was 40.1%, 37.2%
and 36.2%, respectively. Consistent with the increase in Core Markets Adjusted EBITDA, we continue to
experience corresponding increases in Core Markets Adjusted EBITDA as a percent of service revenues due to the
growth in service revenues as well as cost benefits due to the increasing scale of our business in the Core Markets.
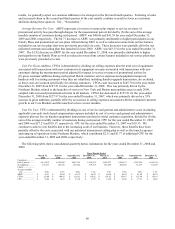
The following table shows a summary of certain quarterly key performance measures for the periods indicated for
our Core Markets.
Three Months Ended
March 31,
2008
June 30,
2008
September 30,
2008
December 31,
2008
March 31,
2009
June 30,
2009
September 30,
2009
December 31,
2009
(Dollars in thousands)
Core Markets
Customers:
End of period ...............................................
.
4,414,519 4,598,049 4,802,692 5,262,682 5,697,581 5,710,226 5,655,785 5,860,613
Net additions................................................
.
451,733 183,530 204,643 459,990 434,899 12,645 (54,441) 204,828
Core Markets Adjusted EBITDA.................
.
$ 192,542 $ 232,011 $ 236,328 $ 240,870 $ 268,418 $ 293,999 $ 315,810 $ 283,258
Core Markets Adjusted EBITDA as a
Percent of Service Revenues ......................
.
34.3% 38.8% 38.9% 36.7% 38.2% 40.9% 42.7% 38.6%