Metro PCS 2009 Annual Report Download - page 90
Download and view the complete annual report
Please find page 90 of the 2009 Metro PCS annual report below. You can navigate through the pages in the report by either clicking on the pages listed below, or by using the keyword search tool below to find specific information within the annual report.-
 1
1 -
2
-
3
-
4
-
5
-
6
-
7
-
8
-
9
-
10
-
11
-
12
-
13
-
14
-
15
-
16
-
17
-
18
-
19
-
20
-
21
-
22
-
23
-
24
-
25
-
26
-
27
-
28
-
29
-
30
-
31
-
32
-
33
-
34
-
35
-
36
-
37
-
38
-
39
-
40
-
41
-
42
-
43
-
44
-
45
-
46
-
47
-
48
-
49
-
50
-
51
-
52
-
53
-
54
-
55
-
56
-
57
-
58
-
59
-
60
-
61
-
62
-
63
-
64
-
65
-
66
-
67
-
68
-
69
-
70
-
71
-
72
-
73
-
74
-
75
-
76
-
77
-
78
-
79
-
 80
80 -
 81
81 -
 82
82 -
 83
83 -
 84
84 -
 85
85 -
 86
86 -
 87
87 -
 88
88 -
 89
89 -
 90
90 -
 91
91 -
 92
92 -
 93
93 -
 94
94 -
 95
95 -
 96
96 -
 97
97 -
 98
98 -
 99
99 -
 100
100 -
101
-
102
-
103
-
104
-
105
-
106
-
107
-
108
-
109
-
110
-
111
-
112
-
113
-
114
-
115
-
116
-
117
-
118
-
119
-
120
-
121
-
122
-
123
-
124
-
125
-
126
-
127
-
128
-
129
-
130
-
131
-
132
-
133
-
134
-
135
-
136
-
137
-
138
-
139
-
140
-
141
-
142
-
143
-
144
-
145
-
146
-
147
-
148
-
149
-
150
-
151
-
152
-
153
-
154
-
155
-
156
-
157
-
158
-
159
-
160
-
161
-
162
-
163
-
164
 |
 |

78
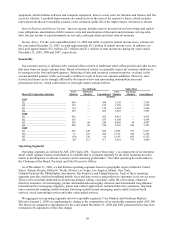
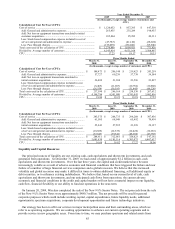
•Core Markets. Core Markets stock-based compensation expense increased approximately $10.2 million, or
46%, to $32.2 million for the year ended December 31, 2008 from $22.0 million for the year ended
December 31, 2007. The increase is primarily related to additional stock options granted to employees in
these markets throughout the year ended December 31, 2008.
•Northeast Markets. Northeast Markets stock-based compensation expense increased $2.9 million, or
approximately 49%, to $8.9 million for the year ended December 31, 2008 from approximately $6.0 million
for the year ended December 31, 2007. The increase is primarily related to additional stock options granted to
employees in these markets throughout the year ended December 31, 2008.
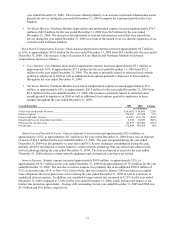
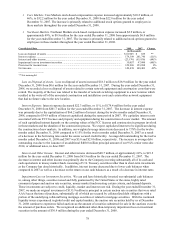
Consolidated Data 2008 2007 Change
(in thousands)
Loss on disposal of assets ................................................................................................................ $ 18,905 $ 655 **
Interest expense ............................................................................................................................... 179,398 201,746 (11)%
Interest and other income................................................................................................................. (23,170) (63,936) (64)%
Impairment loss on investment securities ........................................................................................ 30,857 97,800 (68)%
Provision for income taxes............................................................................................................... 129,986 123,098 6%
Net income....................................................................................................................................... 149,438 100,403 49%
_________________
** Not meaningful.
Loss on Disposal of Assets. Loss on disposal of assets increased $18.3 million to $18.9 million for the year ended
December 31, 2008 from $0.6 million for the year ended December 31, 2007. During the year ended December 31,
2008, we recorded a loss on disposal of assets related to certain network equipment and construction costs that were
retired. The majority of the loss was related to the transfer of network switching equipment to a new location which
resulted in the write-off of the associated construction and installation costs and certain other network equipment
that had no future value to the new location.
Interest Expense. Interest expense decreased $22.3 million, or 11%, to $179.4 million for the year ended
December 31, 2008 from $201.7 million for the year ended December 31, 2007. The decrease in interest expense
was primarily due to the capitalization of $64.2 million of interest during the twelve months ended December 31,
2008, compared to $34.9 million of interest capitalized during the same period in 2007. We capitalize interest costs
associated with our FCC licenses and property and equipment during the construction of a new market. The amount
of such capitalized interest depends on the carrying values of the FCC licenses and construction in progress involved
in those markets and the duration of the construction process. We expect capitalized interest to be significant during
the construction of new markets. In addition, our weighted average interest rate decreased to 7.78% for the twelve
months ended December 31, 2008 compared to 8.15% for the twelve months ended December 31, 2007 as a result
of a decrease in the borrowing rates under the senior secured credit facility. Average debt outstanding for the twelve
months ended December 31, 2008 and 2007 was $3.0 and $2.8 billion, respectively. The increase in average debt
outstanding was due to the issuance of an additional $400.0 million principal amount of our 9¼% senior notes due
2014, or additional notes, in June 2007.
Interest and Other Income. Interest and other income decreased $40.7 million, or approximately 64%, to $23.2
million for the year ended December 31, 2008 from $63.9 million for the year ended December 31, 2007. The
decrease in interest and other income was primarily due to the Company investing substantially all of its cash and
cash equivalents in money market funds consisting of U.S. Treasury securities rather than in short-term investments
as the Company has done historically. In addition, interest income decreased due to lower cash balances when
compared to 2007 as well as a decrease on the return on our cash balances as a result of a decrease in interest rates.
Impairment Loss on Investment Securities. We can and have historically invested our substantial cash balances
in, among other things, securities issued and fully guaranteed by the United States or the states, highly rated
commercial paper and auction rate securities, money market funds meeting certain criteria, and demand deposits.
These investments are subject to credit, liquidity, market and interest rate risk. During the year ended December 31,
2007, we made an original investment of $133.9 million in principal in certain auction rate securities that were rated
AAA/Aaa at the time of purchase, substantially all of which are secured by collateralized debt obligations with a
portion of the underlying collateral being mortgage securities or related to mortgage securities. With the continued
liquidity issues experienced in global credit and capital markets, the auction rate securities held by us at December
31, 2008 continue to experience failed auctions as the amount of securities submitted for sale in the auctions exceeds
the amount of purchase orders. We recognized an additional other-than-temporary impairment loss on investment
securities in the amount of $30.9 million during the year ended December 31, 2008.