Metro PCS 2009 Annual Report Download - page 92
Download and view the complete annual report
Please find page 92 of the 2009 Metro PCS annual report below. You can navigate through the pages in the report by either clicking on the pages listed below, or by using the keyword search tool below to find specific information within the annual report.-
 1
1 -
2
-
3
-
4
-
5
-
6
-
7
-
8
-
9
-
10
-
11
-
12
-
13
-
14
-
15
-
16
-
17
-
18
-
19
-
20
-
21
-
22
-
23
-
24
-
25
-
26
-
27
-
28
-
29
-
30
-
31
-
32
-
33
-
34
-
35
-
36
-
37
-
38
-
39
-
40
-
41
-
42
-
43
-
44
-
45
-
46
-
47
-
48
-
49
-
50
-
51
-
52
-
53
-
54
-
55
-
56
-
57
-
58
-
59
-
60
-
61
-
62
-
63
-
64
-
65
-
66
-
67
-
68
-
69
-
70
-
71
-
72
-
73
-
74
-
75
-
76
-
77
-
78
-
79
-
80
-
81
-
 82
82 -
 83
83 -
 84
84 -
 85
85 -
 86
86 -
 87
87 -
 88
88 -
 89
89 -
 90
90 -
 91
91 -
 92
92 -
 93
93 -
 94
94 -
 95
95 -
 96
96 -
 97
97 -
 98
98 -
 99
99 -
 100
100 -
 101
101 -
 102
102 -
103
-
104
-
105
-
106
-
107
-
108
-
109
-
110
-
111
-
112
-
113
-
114
-
115
-
116
-
117
-
118
-
119
-
120
-
121
-
122
-
123
-
124
-
125
-
126
-
127
-
128
-
129
-
130
-
131
-
132
-
133
-
134
-
135
-
136
-
137
-
138
-
139
-
140
-
141
-
142
-
143
-
144
-
145
-
146
-
147
-
148
-
149
-
150
-
151
-
152
-
153
-
154
-
155
-
156
-
157
-
158
-
159
-
160
-
161
-
162
-
163
-
164
 |
 |

80
results, we generally expect net customer additions to be strongest in the first and fourth quarters. Softening of sales
and increased churn in the second and third quarters of the year usually combine to result in fewer net customer
additions during these quarters. See – “Seasonality.”
Average Revenue Per User. ARPU represents (a) service revenues plus impact to service revenues of
promotional activity less pass through charges for the measurement period, divided by (b) the sum of the average
monthly number of customers during such period. ARPU was $40.68 and $41.39 for year ended December 31,
2009 and 2008, respectively. The $0.71 decrease in ARPU was primarily attributable to higher participation in our
Family Plans and promotional service plans offered during 2009, as well as reduced revenue from certain features
included in our service plans that were previously provided a la carte. These decreases were partially offset by our
unlimited international calling plan that launched in June 2009. ARPU was $43.31 for the year ended December 31,
2007. The $1.92 decrease in ARPU for the year ended December 31, 2008, was primarily attributable to higher
participation in our Family Plans as well as reduced revenue from certain features included in our service plans that
were previously provided a la carte.
Cost Per Gross Addition. CPGA is determined by dividing (a) selling expenses plus the total cost of equipment
associated with transactions with new customers less equipment revenues associated with transactions with new
customers during the measurement period adjusted for impact to service revenues of promotional activity by
(b) gross customer additions during such period. Retail customer service expenses and equipment margin on
handsets sold to existing customers when they are identified, including handset upgrade transactions, are excluded,
as these costs are incurred specifically for existing customers. CPGA costs increased to $145.79 for the year ended
December 31, 2009 from $127.21 for the year ended December 31, 2008. This was primarily driven by the
Northeast Markets related to the launches of service in New York and Boston metropolitan areas in early 2009,
coupled with increased promotional activities in all markets. CPGA has decreased to $127.21 for the year ended
December 31, 2008 from $127.97 for the year ended December 31, 2007, which was primarily driven by a 33%
increase in gross additions, partially offset by an increase in selling expenses associated with the continued customer
growth in our Core Markets and the launch of service in new markets.
Cost Per User. CPU is determined by dividing (a) cost of service and general and administrative costs (excluding
applicable non-cash stock-based compensation expense included in cost of service and general and administrative
expense) plus net loss on handset equipment transactions unrelated to initial customer acquisition, divided by (b) the
sum of the average monthly number of customers during such period. CPU for the year ended December 31, 2009
and 2008 was $17.23 and $18.17, respectively. CPU for the year ended December 31, 2007 was $18.33. We
continue to achieve cost benefits due to the increasing scale of our business. However, these benefits have been
partially offset by the costs associated with our unlimited international calling plan as well as the launch expenses
and ramp up of operations in the Northeast Markets, which contributed $2.11 and $1.77 of additional CPU for the
year ended December 31, 2009 and 2008, respectively.
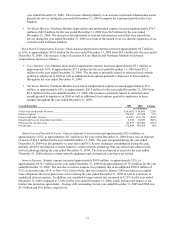
The following table shows consolidated quarterly metric information for the years ended December 31, 2008 and
2009.
Three Months Ended
March 31,
2008
June 30,
2008
September 30,
2008
December 31,
2008
March 31,
2009
June 30,
2009
September 30,
2009
December 31,
2009
Customers:..............
End of period.......... 4,414,519 4,598,049 4,847,314 5,366,833 6,050,527 6,256,112 6,322,269 6,639,524
Net additions........... 451,733 183,530 249,265 519,519 683,694 205,585 66,157 317,255
Churn:.....................
Average monthly
rate ....................... 4.0% 4.5% 4.8% 5.1% 5.0% 5.8% 5.8% 5.3%
ARPU ..................... $ 42.51 $ 42.05 $ 40.73 $ 40.52 $ 40.40 $ 40.52 $ 41.08 $ 40.70
CPGA ..................... $ 125.00 $ 140.82 $ 128.21 $ 119.82 $ 134.23 $ 159.87 $ 153.94 $ 138.36
CPU ........................ $ 18.86 $ 18.23 $ 18.18 $ 17.55 $ 16.69 $ 16.82 $ 17.27 $ 18.06