Metro PCS 2009 Annual Report Download - page 147
Download and view the complete annual report
Please find page 147 of the 2009 Metro PCS annual report below. You can navigate through the pages in the report by either clicking on the pages listed below, or by using the keyword search tool below to find specific information within the annual report.-
 1
1 -
2
-
3
-
4
-
5
-
6
-
7
-
8
-
9
-
10
-
11
-
12
-
13
-
14
-
15
-
16
-
17
-
18
-
19
-
20
-
21
-
22
-
23
-
24
-
25
-
26
-
27
-
28
-
29
-
30
-
31
-
32
-
33
-
34
-
35
-
36
-
37
-
38
-
39
-
40
-
41
-
42
-
43
-
44
-
45
-
46
-
47
-
48
-
49
-
50
-
51
-
52
-
53
-
54
-
55
-
56
-
57
-
58
-
59
-
60
-
61
-
62
-
63
-
64
-
65
-
66
-
67
-
68
-
69
-
70
-
71
-
72
-
73
-
74
-
75
-
76
-
77
-
78
-
79
-
80
-
81
-
82
-
83
-
84
-
85
-
86
-
87
-
88
-
89
-
90
-
91
-
92
-
93
-
94
-
95
-
96
-
97
-
98
-
99
-
100
-
101
-
102
-
103
-
104
-
105
-
106
-
107
-
108
-
109
-
110
-
111
-
112
-
113
-
114
-
115
-
116
-
117
-
118
-
119
-
120
-
121
-
122
-
123
-
124
-
125
-
126
-
127
-
128
-
129
-
130
-
131
-
132
-
133
-
134
-
135
-
136
-
 137
137 -
 138
138 -
 139
139 -
 140
140 -
 141
141 -
 142
142 -
 143
143 -
 144
144 -
 145
145 -
 146
146 -
 147
147 -
 148
148 -
 149
149 -
 150
150 -
 151
151 -
 152
152 -
 153
153 -
 154
154 -
 155
155 -
 156
156 -
 157
157 -
158
-
159
-
160
-
161
-
162
-
163
-
164
 |
 |

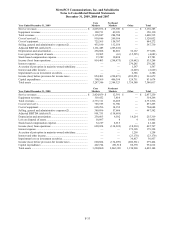
MetroPCS Communications, Inc. and Subsidiaries
Notes to Consolidated Financial Statements
December 31, 2009, 2008 and 2007
F-33
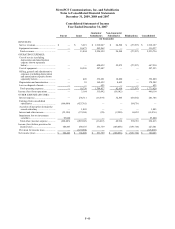
Year Ended December 31, 2009
Core
Markets
Northeast
Markets Other Total
Service revenues ........................................................................... $ 2,895,076 $ 235,309 $ — $ 3,130,385
Equipment revenues...................................................................... 300,731 49,399 — 350,130
Total revenues............................................................................... 3,195,807 284,708 — 3,480,515
Cost of service(1).......................................................................... 910,866 209,186 — 1,120,052
Cost of equipment......................................................................... 725,565 158,707 — 884,272
Selling, general and administrative expenses(2) ........................... 435,180 132,550 — 567,730
Adjusted EBITDA (deficit)(3)...................................................... 1,161,485 (205,241) —
Depreciation and amortization...................................................... 258,888 82,801 36,167 377,856
Loss (gain) on disposal of assets................................................... 10,905 (63) (15,525) (4,683)
Stock-based compensation expense.............................................. 37,289 10,494 — 47,783
Income (loss) from operations ...................................................... 854,403 (298,473) (20,642) 535,288
Interest expense ............................................................................ — — 270,285 270,285
Accretion of put option in majority-owned subsidiary.................. — — 1,567 1,567
Interest and other income.............................................................. — — (2,629) (2,629)
Impairment loss on investment securities ..................................... — — 2,386 2,386
Income (loss) before provision for income taxes.......................... 854,403 (298,473) (292,251) 263,679
Capital expenditures ..................................................................... 300,569 406,394 124,711 831,674
Total assets ................................................................................... 3,247,306 2,384,323 1,754,388 7,386,017
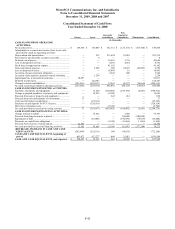
Year Ended December 31, 2008
Core
Markets
Northeast
Markets Other Total
Service revenues ........................................................................... $ 2,424,859 $ 12,391 $ — $ 2,437,250
Equipment revenues...................................................................... 310,452 3,814 — 314,266
Total revenues............................................................................... 2,735,311 16,205 — 2,751,516
Cost of service(1).......................................................................... 785,595 71,700 — 857,295
Cost of equipment......................................................................... 690,296 14,352 — 704,648
Selling, general and administrative expenses(2) ........................... 389,896 57,686 — 447,582
Adjusted EBITDA (deficit)(3)...................................................... 901,751 (118,618) —
Depreciation and amortization...................................................... 230,603 6,502 18,214 255,319
Loss on disposal of assets ............................................................. 18,897 4 4 18,905
Stock-based compensation expense.............................................. 32,227 8,915 — 41,142
Income (loss) from operations ...................................................... 620,024 (134,039) (18,218) 467,767
Interest expense ............................................................................ — — 179,398 179,398
Accretion of put option in majority-owned subsidiary.................. — — 1,258 1,258
Interest and other income.............................................................. — — (23,170) (23,170)
Impairment loss on investment securities ..................................... — — 30,857 30,857
Income (loss) before provision for income taxes.......................... 620,024 (134,039) (206,561) 279,424
Capital expenditures ..................................................................... 402,724 491,518 60,370 954,612
Total assets ................................................................................... 3,204,860 2,062,320 1,154,968 6,422,148