Metro PCS 2009 Annual Report Download - page 85
Download and view the complete annual report
Please find page 85 of the 2009 Metro PCS annual report below. You can navigate through the pages in the report by either clicking on the pages listed below, or by using the keyword search tool below to find specific information within the annual report.-
 1
1 -
2
-
3
-
4
-
5
-
6
-
7
-
8
-
9
-
10
-
11
-
12
-
13
-
14
-
15
-
16
-
17
-
18
-
19
-
20
-
21
-
22
-
23
-
24
-
25
-
26
-
27
-
28
-
29
-
30
-
31
-
32
-
33
-
34
-
35
-
36
-
37
-
38
-
39
-
40
-
41
-
42
-
43
-
44
-
45
-
46
-
47
-
48
-
49
-
50
-
51
-
52
-
53
-
54
-
55
-
56
-
57
-
58
-
59
-
60
-
61
-
62
-
63
-
64
-
65
-
66
-
67
-
68
-
69
-
70
-
71
-
72
-
73
-
74
-
 75
75 -
 76
76 -
 77
77 -
 78
78 -
 79
79 -
 80
80 -
 81
81 -
 82
82 -
 83
83 -
 84
84 -
 85
85 -
 86
86 -
 87
87 -
 88
88 -
 89
89 -
 90
90 -
 91
91 -
 92
92 -
 93
93 -
 94
94 -
 95
95 -
96
-
97
-
98
-
99
-
100
-
101
-
102
-
103
-
104
-
105
-
106
-
107
-
108
-
109
-
110
-
111
-
112
-
113
-
114
-
115
-
116
-
117
-
118
-
119
-
120
-
121
-
122
-
123
-
124
-
125
-
126
-
127
-
128
-
129
-
130
-
131
-
132
-
133
-
134
-
135
-
136
-
137
-
138
-
139
-
140
-
141
-
142
-
143
-
144
-
145
-
146
-
147
-
148
-
149
-
150
-
151
-
152
-
153
-
154
-
155
-
156
-
157
-
158
-
159
-
160
-
161
-
162
-
163
-
164
 |
 |

73
year ended December 31, 2008. The increase related primarily to an increase in network infrastructure assets
placed into service during the year ended December 31, 2009 to support the continued growth in the Core
Markets.
•Northeast Markets. Northeast Markets depreciation and amortization expense increased approximately $76.3
million to $82.8 million for the year ended December 31, 2009 from $6.5 million for the year ended
December 31, 2008. The increase related primarily to network infrastructure assets that were placed into
service during the year ended December 31, 2009 as a result of the launch of service and the expansion of our
network in the Northeast Markets.
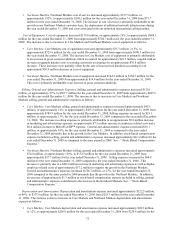
Stock-Based Compensation Expense. Stock-based compensation expense increased approximately $6.7 million,
or 16%, to approximately $47.8 million for the year ended December 31, 2009 from $41.1 million for the year ended
December 31, 2008. The increase is due to increases in Core Markets and Northeast Markets stock-based
compensation expense as follows:
•Core Markets. Core Markets stock-based compensation expense increased approximately $5.1 million, or
approximately 16%, to approximately $37.3 million for the year ended December 31, 2009 from $32.2
million for the year ended December 31, 2008. The increase is primarily related to restricted stock awards
granted to employees in 2009 as well as additional stock options granted to employees in these markets
throughout the year ended December 31, 2009.
•Northeast Markets. Northeast Markets stock-based compensation expense increased approximately $1.6
million, or approximately 18%, to approximately $10.5 million for the year ended December 31, 2009 from
$8.9 million for the year ended December 31, 2008. The increase is primarily related to restricted stock
awards granted to employees in 2009 as well as additional stock options granted to employees in these
markets throughout the year ended December 31, 2009.
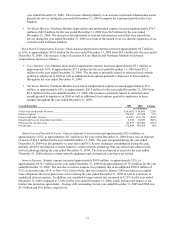
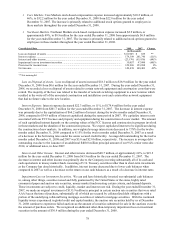
Consolidated Data 2009 2008 Change
(in thousands)
(Gain) loss on disposal of assets ...................................................................................................... $ (4,683) $ 18,905 125%
Interest expense ............................................................................................................................... 270,285 179,398 51%
Interest and other income................................................................................................................. (2,629) (23,170) (89)%
Impairment loss on investment securities ........................................................................................ 2,386 30,857 (92)%
Provision for income taxes............................................................................................................... 86,835 129,986 (33)%
Net income....................................................................................................................................... 176,844 149,438 18%
(Gain) loss on Disposal of Assets. Gain on disposal of assets increased approximately $23.6 million, or
approximately 125%, to approximately $4.7 million for the year ended December 31, 2009 from a loss on disposal
of assets of $18.9 million for the year ended December 31, 2008. The gain recognized during the year ended
December 31, 2009 was due primarily to asset sales and FCC license exchanges consummated during the year,
partially offset by the disposal of assets related to certain network technology that was retired and replaced with
newer technology during the year ended December 31, 2009. The loss on disposal of assets for the year ended
December 31, 2008 related to certain network equipment and construction costs that were retired.
Interest Expense. Interest expense increased approximately $90.9 million, or approximately 51%, to
approximately $270.3 million for the year ended December 31, 2009 from approximately $179.4 million for the year
ended December 31, 2008. The increase in interest expense was primarily due to an additional $550.0 million of
9¼% senior notes due 2014, or New 9¼% Senior Notes, that were issued in January 2009 and interest on capital
lease obligations that were placed into service during the year ended December 31, 2009 as well as a decrease in
capitalized interest expense. In addition, our weighted average interest rate increased to 8.23% for the year ended
December 31, 2009 compared to 7.78% for the year ended December 31, 2008, which includes the impact of our
interest rate protection agreements. Average debt outstanding for the year ended December 31, 2009 and 2008 was
$3.5 billion and $3.0 billion, respectively.