Metro PCS 2009 Annual Report Download - page 148
Download and view the complete annual report
Please find page 148 of the 2009 Metro PCS annual report below. You can navigate through the pages in the report by either clicking on the pages listed below, or by using the keyword search tool below to find specific information within the annual report.-
 1
1 -
2
-
3
-
4
-
5
-
6
-
7
-
8
-
9
-
10
-
11
-
12
-
13
-
14
-
15
-
16
-
17
-
18
-
19
-
20
-
21
-
22
-
23
-
24
-
25
-
26
-
27
-
28
-
29
-
30
-
31
-
32
-
33
-
34
-
35
-
36
-
37
-
38
-
39
-
40
-
41
-
42
-
43
-
44
-
45
-
46
-
47
-
48
-
49
-
50
-
51
-
52
-
53
-
54
-
55
-
56
-
57
-
58
-
59
-
60
-
61
-
62
-
63
-
64
-
65
-
66
-
67
-
68
-
69
-
70
-
71
-
72
-
73
-
74
-
75
-
76
-
77
-
78
-
79
-
80
-
81
-
82
-
83
-
84
-
85
-
86
-
87
-
88
-
89
-
90
-
91
-
92
-
93
-
94
-
95
-
96
-
97
-
98
-
99
-
100
-
101
-
102
-
103
-
104
-
105
-
106
-
107
-
108
-
109
-
110
-
111
-
112
-
113
-
114
-
115
-
116
-
117
-
118
-
119
-
120
-
121
-
122
-
123
-
124
-
125
-
126
-
127
-
128
-
129
-
130
-
131
-
132
-
133
-
134
-
135
-
136
-
137
-
 138
138 -
 139
139 -
 140
140 -
 141
141 -
 142
142 -
 143
143 -
 144
144 -
 145
145 -
 146
146 -
 147
147 -
 148
148 -
 149
149 -
 150
150 -
 151
151 -
 152
152 -
 153
153 -
 154
154 -
 155
155 -
 156
156 -
 157
157 -
 158
158 -
159
-
160
-
161
-
162
-
163
-
164
 |
 |

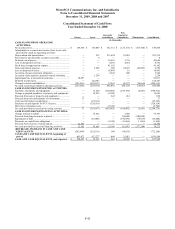
MetroPCS Communications, Inc. and Subsidiaries
Notes to Consolidated Financial Statements
December 31, 2009, 2008 and 2007
F-34
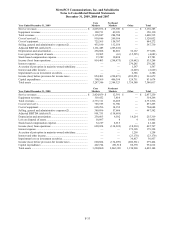
Year Ended December 31, 2007
Core
Markets
Northeast
Markets Other Total
Service revenues ........................................................................... $ 1,919,197 $ — $ — $ 1,919,197
Equipment revenues...................................................................... 316,537 — — 316,537
Total revenues............................................................................... 2,235,734 — — 2,235,734
Cost of service(1).......................................................................... 642,206 5,304 — 647,510
Cost of equipment......................................................................... 597,233 — — 597,233
Selling, general and administrative expenses(2) ........................... 323,572 28,448 — 352,020
Adjusted EBITDA (deficit)(3)...................................................... 694,761 (27,766) —
Depreciation and amortization...................................................... 170,876 319 7,007 178,202
(Gain) loss on disposal of assets ................................................... (2,621) 21 3,255 655
Stock-based compensation expense.............................................. 22,037 5,987 — 28,024
Income (loss) from operations ...................................................... 504,468 (34,092) (10,262) 460,114
Interest expense ............................................................................ — — 201,746 201,746
Accretion of put option in majority-owned subsidiary.................. — — 1,003 1,003
Interest and other income.............................................................. — — (63,936) (63,936)
Impairment loss on investment securities ..................................... — — 97,800 97,800
Income (loss) before provision for income taxes.......................... 504,468 (34,092) (246,875) 223,501
Capital expenditures ..................................................................... 579,131 77,926 110,652 767,709
Total assets ................................................................................... 2,927,498 1,020,718 1,857,914 5,806,130
____________________________
(1) Cost of service includes stock-based compensation expense disclosed separately. For the years ended December 31, 2009, 2008 and 2007,
cost of service includes $4.2 million, $2.9 million and $1.8 million, respectively, of stock-based compensation expense.
(2) Selling, general and administrative expenses include stock-based compensation expense disclosed separately. For the years ended
December 31, 2009, 2008 and 2007, selling, general and administrative expenses include $43.6 million, $38.2 million and $26.2 million,
respectively, of stock-based compensation expense.
(3) Adjusted EBITDA (deficit) is presented in accordance with ASC 280 as it is the primary financial measure utilized by management to
facilitate evaluation of each segments’ ability to meet future debt service, capital expenditures and working capital requirements and to
fund future growth.
The following table reconciles segment Adjusted EBITDA (Deficit) for the years ended December 31, 2009,
2008 and 2007 to consolidated income before provision for income taxes:
2009 2008 2007
Segment Adjusted EBITDA (Deficit):
Core Markets Adjusted EBITDA................................................................................. $ 1,161,485 $ 901,751 $ 694,761
Northeast Markets Adjusted EBITDA (Deficit) .......................................................... (205,241) (118,618) (27,766)
Total............................................................................................................................ 956,244 783,133 666,995
Depreciation and amortization..................................................................................... (377,856) (255,319) (178,202)
Gain (loss) on disposal of assets .................................................................................. 4,683 (18,905) (655)
Stock-based compensation expense............................................................................. (47,783) (41,142) (28,024)
Interest expense ........................................................................................................... (270,285) (179,398) (201,746)
Accretion of put option in majority-owned subsidiary................................................. (1,567) (1,258) (1,003)
Interest and other income............................................................................................. 2,629 23,170 63,936
Impairment loss on investment securities .................................................................... (2,386) (30,857) (97,800)
Consolidated income before provision for income taxes......................................... $ 263,679 $ 279,424 $ 223,501
18. Guarantor Subsidiaries:
In connection with Wireless’ sale of the 91/4% Senior Notes and the entry into the Senior Secured Credit Facility,
MetroPCS, MetroPCS Inc., and each of Wireless’ direct and indirect present and future wholly-owned domestic
subsidiaries (the “guarantor subsidiaries”), provided guarantees on the 91/4% Senior Notes and Senior Secured Credit
Facility. These guarantees are full and unconditional as well as joint and several. Certain provisions of the Senior
Secured Credit Facility and the indentures relating to the 9¼% Senior Notes restrict the ability of Wireless to loan
funds to MetroPCS. However, Wireless is allowed to make certain permitted payments to MetroPCS under the
terms of the Senior Secured Credit Facility and the indentures relating to the 9¼% Senior Notes. Royal Street and
MetroPCS Finance, Inc. (“MetroPCS Finance”) (the “non-guarantor subsidiaries”) are not guarantors of the 91/4%
Senior Notes or the Senior Secured Credit Facility.