Metro PCS 2009 Annual Report Download - page 91
Download and view the complete annual report
Please find page 91 of the 2009 Metro PCS annual report below. You can navigate through the pages in the report by either clicking on the pages listed below, or by using the keyword search tool below to find specific information within the annual report.-
 1
1 -
2
-
3
-
4
-
5
-
6
-
7
-
8
-
9
-
10
-
11
-
12
-
13
-
14
-
15
-
16
-
17
-
18
-
19
-
20
-
21
-
22
-
23
-
24
-
25
-
26
-
27
-
28
-
29
-
30
-
31
-
32
-
33
-
34
-
35
-
36
-
37
-
38
-
39
-
40
-
41
-
42
-
43
-
44
-
45
-
46
-
47
-
48
-
49
-
50
-
51
-
52
-
53
-
54
-
55
-
56
-
57
-
58
-
59
-
60
-
61
-
62
-
63
-
64
-
65
-
66
-
67
-
68
-
69
-
70
-
71
-
72
-
73
-
74
-
75
-
76
-
77
-
78
-
79
-
80
-
 81
81 -
 82
82 -
 83
83 -
 84
84 -
 85
85 -
 86
86 -
 87
87 -
 88
88 -
 89
89 -
 90
90 -
 91
91 -
 92
92 -
 93
93 -
 94
94 -
 95
95 -
 96
96 -
 97
97 -
 98
98 -
 99
99 -
 100
100 -
 101
101 -
102
-
103
-
104
-
105
-
106
-
107
-
108
-
109
-
110
-
111
-
112
-
113
-
114
-
115
-
116
-
117
-
118
-
119
-
120
-
121
-
122
-
123
-
124
-
125
-
126
-
127
-
128
-
129
-
130
-
131
-
132
-
133
-
134
-
135
-
136
-
137
-
138
-
139
-
140
-
141
-
142
-
143
-
144
-
145
-
146
-
147
-
148
-
149
-
150
-
151
-
152
-
153
-
154
-
155
-
156
-
157
-
158
-
159
-
160
-
161
-
162
-
163
-
164
 |
 |

79
Provision for Income Taxes. Income tax expense was $130.0 million and $123.1 million for the years ended
December 31, 2008 and 2007, respectively. The effective tax rate was 46.5% and 54.4% for the years ended
December 31, 2008 and 2007, respectively. Our effective rates differ from the statutory federal rate of 35.0% due to
state and local taxes, non-deductible expenses and an increase in the valuation allowance related to the impairment
loss recognized on investment securities.
Net Income. Net income increased $49.0 million, or approximately 49%, to $149.4 million for the year ended
December 31, 2008 compared to $100.4 million for the year ended December 31, 2007. The increase in net income
was primarily attributable to an increase in income from operations, a decrease in interest expense and a decrease in
the impairment loss on investment securities. These items were partially offset by lower interest and other income
for the year ended December 31, 2008.
Performance Measures
In managing our business and assessing our financial performance, we supplement the information provided by
financial statement measures with several customer-focused performance metrics that are widely used in the
wireless industry. These metrics include average revenue per user per month, or ARPU, which measures service
revenue per customer; cost per gross customer addition, or CPGA, which measures the average cost of acquiring a
new customer; cost per user per month, or CPU, which measures the non-selling cash cost of operating our business
on a per customer basis; and churn, which measures turnover in our customer base. For a reconciliation of Non-
GAAP performance measures and a further discussion of the measures, please read “— Reconciliation of Non-
GAAP Financial Measures” below.
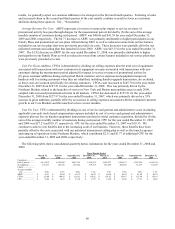
The following table shows annual metric information for 2007, 2008 and 2009.
Year Ended December 31,
2009 2008 2007
Customers:
End of period ............................................................................................
.
6,639,524 5,366,833 3,962,786
Net additions.............................................................................................
.
1,272,691 1,404,047 1,021,800
Churn:
Average monthly rate................................................................................
.
5.5% 4.7% 4.7%
ARPU ........................................................................................................
.
$ 40.68 $ 41.39 $ 43.31
CPGA ........................................................................................................
.
$ 145.79 $ 127.21 $ 127.97
CPU ...........................................................................................................
.
$ 17.23 $ 18.17 $ 18.33
Customers. Net customer additions were 1,272,691 for the year ended December 31, 2009, compared to
1,404,047 for the year ended December 31, 2008. The decrease in net customer additions is primarily attributable to
current economic conditions and increased competition. Total customers were 6,639,524 as of December 31, 2009,
an increase of approximately 24% over the customer total as of December 31, 2008. The increase in total customers
is primarily attributable to the continued demand for our service offerings and the launch of our services in the New
York and Boston metropolitan areas in early 2009. Net customer additions were 1,404,047 for the year ended
December 31, 2008, compared to 1,021,800 for the year ended December 31, 2007. Total customers were 5,366,833
as of December 31, 2008, an increase of 35% over the customer total as of December 31, 2007. The increase in total
customers in 2008 was largely attributable to the continued demand for our service offerings, and the launch of our
services in new markets.
Churn. As we do not require a long-term service contract, our churn percentage is expected to be higher than
traditional wireless carriers that require customers to sign a one- to two-year contract with significant early
termination fees. Average monthly churn represents (a) the number of customers who have been disconnected from
our system during the measurement period less the number of customers who have reactivated service, divided by
(b) the sum of the average monthly number of customers during such period. We classify delinquent customers as
churn after they have been delinquent for 30 days. In addition, when an existing customer establishes a new account
in connection with the purchase of an upgraded or replacement phone and does not identify themselves as an
existing customer, we count the phone leaving service as a churn and the new phone entering service as a gross
customer addition. Churn for the year ended December 31, 2009 was 5.5%, compared to 4.7% for the year ended
December 31, 2008. The increase in churn was primarily related to incremental gross additions of approximately
1.3 million customers during the nine months ended September 30, 2009 as compared to the same period in 2008,
coupled with churn from increased competition. Our customer activity is influenced by seasonal effects related to
traditional retail selling periods and other factors that arise from our target customer base. Based on historical