Metro PCS 2009 Annual Report Download - page 9
Download and view the complete annual report
Please find page 9 of the 2009 Metro PCS annual report below. You can navigate through the pages in the report by either clicking on the pages listed below, or by using the keyword search tool below to find specific information within the annual report.-
 1
1 -
 2
2 -
 3
3 -
 4
4 -
 5
5 -
 6
6 -
 7
7 -
 8
8 -
 9
9 -
 10
10 -
 11
11 -
 12
12 -
 13
13 -
 14
14 -
 15
15 -
 16
16 -
 17
17 -
 18
18 -
 19
19 -
 20
20 -
21
-
22
-
23
-
24
-
25
-
26
-
27
-
28
-
29
-
30
-
31
-
32
-
33
-
34
-
35
-
36
-
37
-
38
-
39
-
40
-
41
-
42
-
43
-
44
-
45
-
46
-
47
-
48
-
49
-
50
-
51
-
52
-
53
-
54
-
55
-
56
-
57
-
58
-
59
-
60
-
61
-
62
-
63
-
64
-
65
-
66
-
67
-
68
-
69
-
70
-
71
-
72
-
73
-
74
-
75
-
76
-
77
-
78
-
79
-
80
-
81
-
82
-
83
-
84
-
85
-
86
-
87
-
88
-
89
-
90
-
91
-
92
-
93
-
94
-
95
-
96
-
97
-
98
-
99
-
100
-
101
-
102
-
103
-
104
-
105
-
106
-
107
-
108
-
109
-
110
-
111
-
112
-
113
-
114
-
115
-
116
-
117
-
118
-
119
-
120
-
121
-
122
-
123
-
124
-
125
-
126
-
127
-
128
-
129
-
130
-
131
-
132
-
133
-
134
-
135
-
136
-
137
-
138
-
139
-
140
-
141
-
142
-
143
-
144
-
145
-
146
-
147
-
148
-
149
-
150
-
151
-
152
-
153
-
154
-
155
-
156
-
157
-
158
-
159
-
160
-
161
-
162
-
163
-
164
 |
 |
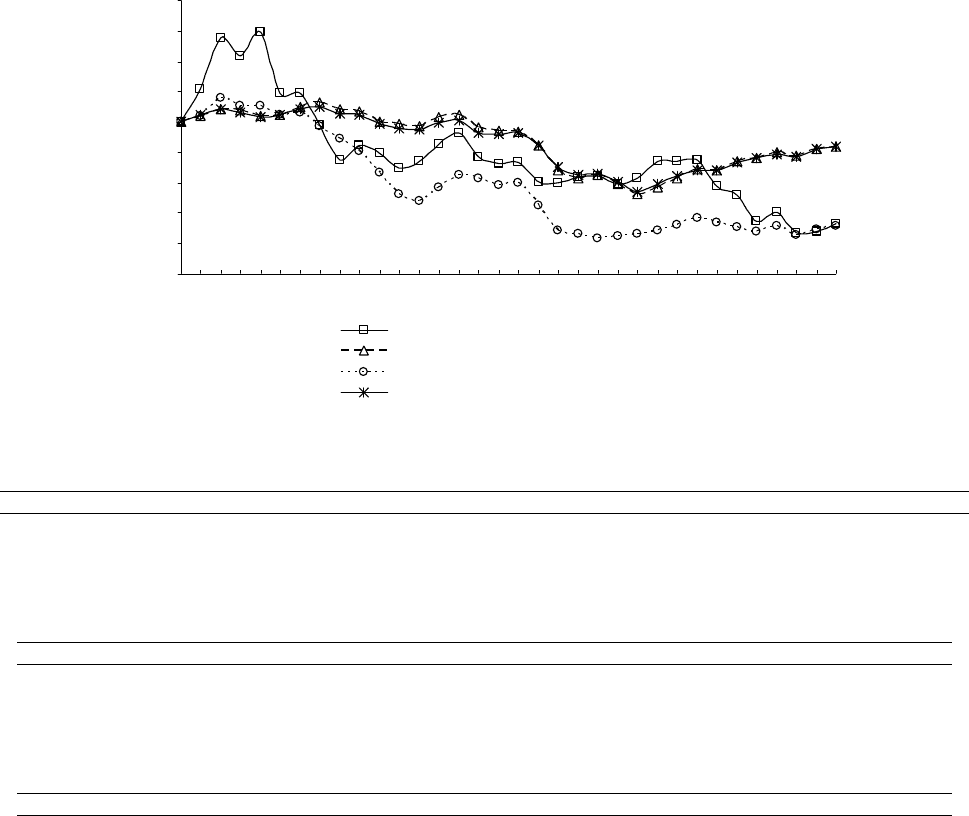
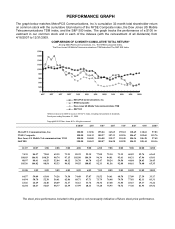
PERFORMANCE GRAPH
The graph below matches MetroPCS Communications, Inc.'s cumulative 32-month total shareholder return
on common stock with the cumulative total returns of the NYSE Composite index, the Dow Jones US Mobile
Telecommunications TSM index, and the S&P 500 index. The graph tracks the performance of a $100 in-
vestment in our common stock and in each of the indexes (with the reinvestment of all dividends) from
4/18/2007 to 12/31/2009.
COMPARISON OF 32 MONTH CUMULATIVE TOTAL RETURN*
Among MetroPCS Communications, Inc., The NYSE Composite Index,
The Dow Jones US Mobile Telecommunications TSM Index And The S&P 500 Index
$0
$20
$40
$60
$80
$100
$120
$140
$160
$180
4/07 6/07 9/07 12/07 3/08 6/08 9/08 12/08 3/09 6/09 9/09 12/09
MetroPCS Communications, Inc.
NYSE Composite
Dow Jones US Mobile Telecommunications TSM
S&P 500
*$100 invested on 4/18/07 in stock or 3/31/07 in index, including reinvestment of dividends.
Fiscal year ending December 31, 2009.
Copyright© 2010 Dow Jones & Co. All rights reserved.
4/18/07 4/07 5/07 6/07 7/07 8/07 9/07 10/07
MetroPCS Communications, Inc. 100.00 121.96 155.04 143.65 159.22 118.65 118.61 97.83
NYSE Composite 100.00 104.13 108.27 107.33 103.96 104.67 109.65 112.76
Dow Jones US Mobile Telecommunications TSM 100.00 104.00 116.08 110.17 110.40 104.36 106.38 97.45
S&P 500 100.00 104.43 108.07 106.28 102.98 104.53 108.44 110.16
11/07 12/07 1/08 2/08 3/08 4/08 5/08 6/08 7/08 8/08 9/08 10/08 11/08
74.35 84.57 79.04 69.35 73.91 85.39 92.35 77.00 72.30 73.35 60.83 59.74 63.65
108.03 106.91 100.29 98.74 97.15 102.90 104.39 96.34 94.01 93.61 84.31 67.96 63.01
88.97 80.41 66.55 52.04 48.12 56.70 64.78 62.47 58.24 59.50 44.84 28.63 26.45
105.56 104.82 98.54 95.33 94.92 99.55 100.83 92.33 91.56 92.88 84.61 70.40 65.35
12/08 1/09 2/09 3/09 4/09 5/09 6/09 7/09 8/09 9/09 10/09 11/09 12/09
64.57 59.09 63.04 74.26 74.30 74.48 57.87 51.52 34.61 40.70 27.09 27.39 33.17
64.94 58.70 52.38 56.61 62.86 68.71 67.71 73.79 76.48 79.70 77.81 82.11 83.31
23.26 24.69 26.40 28.69 32.17 36.61 33.74 30.36 27.68 31.50 25.67 29.17 31.22
66.04 60.47 54.03 58.77 64.39 67.99 68.13 73.28 75.93 78.76 77.30 81.93 83.52
The stock price performance included in this graph is not necessarily indicative of future stock price performance.