Metro PCS 2009 Annual Report Download - page 152
Download and view the complete annual report
Please find page 152 of the 2009 Metro PCS annual report below. You can navigate through the pages in the report by either clicking on the pages listed below, or by using the keyword search tool below to find specific information within the annual report.-
 1
1 -
2
-
3
-
4
-
5
-
6
-
7
-
8
-
9
-
10
-
11
-
12
-
13
-
14
-
15
-
16
-
17
-
18
-
19
-
20
-
21
-
22
-
23
-
24
-
25
-
26
-
27
-
28
-
29
-
30
-
31
-
32
-
33
-
34
-
35
-
36
-
37
-
38
-
39
-
40
-
41
-
42
-
43
-
44
-
45
-
46
-
47
-
48
-
49
-
50
-
51
-
52
-
53
-
54
-
55
-
56
-
57
-
58
-
59
-
60
-
61
-
62
-
63
-
64
-
65
-
66
-
67
-
68
-
69
-
70
-
71
-
72
-
73
-
74
-
75
-
76
-
77
-
78
-
79
-
80
-
81
-
82
-
83
-
84
-
85
-
86
-
87
-
88
-
89
-
90
-
91
-
92
-
93
-
94
-
95
-
96
-
97
-
98
-
99
-
100
-
101
-
102
-
103
-
104
-
105
-
106
-
107
-
108
-
109
-
110
-
111
-
112
-
113
-
114
-
115
-
116
-
117
-
118
-
119
-
120
-
121
-
122
-
123
-
124
-
125
-
126
-
127
-
128
-
129
-
130
-
131
-
132
-
133
-
134
-
135
-
136
-
137
-
138
-
139
-
140
-
141
-
 142
142 -
 143
143 -
 144
144 -
 145
145 -
 146
146 -
 147
147 -
 148
148 -
 149
149 -
 150
150 -
 151
151 -
 152
152 -
 153
153 -
 154
154 -
 155
155 -
 156
156 -
 157
157 -
 158
158 -
 159
159 -
 160
160 -
 161
161 -
 162
162 -
163
-
164
 |
 |

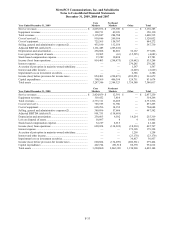
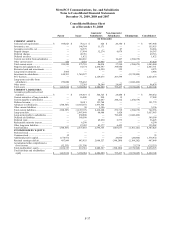
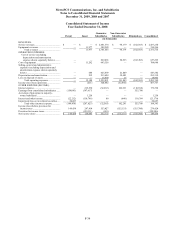
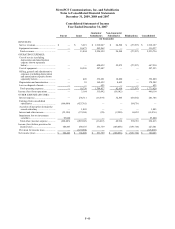
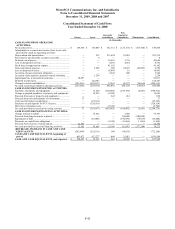
MetroPCS Communications, Inc. and Subsidiaries
Notes to Consolidated Financial Statements
December 31, 2009, 2008 and 2007
F-38
Consolidated Statement of Income
Year Ended December 31, 2009
Parent Issuer
Guarantor
Subsidiaries
Non-Guarantor
Subsidiaries Eliminations Consolidated
(in thousands)
REVENUES:
Service revenues...................................
.
$ — $ — $ 3,134,427 $ 160,550 $ (164,592) $ 3,130,385
Equipment revenues .............................
.
—16,409 333,721 — — 350,130
Total revenues.............................
.
— 16,409 3,468,148 160,550 (164,592) 3,480,515
OPERATING EXPENSES:
Cost of service (excluding
depreciation and amortization
expense shown separately
below)............................................
.
— — 1,177,473 107,171 (164,592) 1,120,052
Cost of equipment.................................
.
— 15,336 868,936 — — 884,272
Selling, general and administrative
expenses (excluding depreciation
and amortization expense shown
separately below) ...............................
.
— 1,074 545,310 21,346 — 567,730
Depreciation and amortization .............
.
— 228 325,589 52,039 — 377,856
(Gain) loss on disposal of assets ..........
.
— — (4,884) 201 —(4,683)
Total operating expenses ............
.
—16,638 2,912,424 180,757 (164,592) 2,945,227
(Loss) income from operations ............
.
— (229) 555,724 (20,207) — 535,288
OTHER EXPENSE (INCOME):
Interest expense ....................................
.
— 270,662 3,408 131,631 (135,416) 270,285
Intercompany expense..........................
.
— — 772 — (772) —
Earnings from consolidated
subsidiaries.........................................
.
(174,388) (402,358) — — 576,746 —
Accretion of put option in
majority-owned subsidiary ................
.
— 1,567 — — — 1,567
Interest and other income .....................
.
(4,842) (133,079) (113) (11) 135,416 (2,629)
Intercompany income ...........................
.
— — — (772) 772 —
Impairment loss on investment
securities.............................................
.
2,386 — — ——2,386
Total other (income) expense .....
.
(176,844) (263,208) 4,067 130,848 576,746 271,609
Income (loss) before provision for
income taxes.......................................
.
176,844 262,979 551,657 (151,055) (576,746) 263,679
Provision for income taxes ...................
.
—(88,591) 1,756 — — (86,835)
Net income (loss) $ 176,844 $ 174,388 $ 553,413 $ (151,055) $ (576,746) $ 176,844