Metro PCS 2009 Annual Report Download - page 94
Download and view the complete annual report
Please find page 94 of the 2009 Metro PCS annual report below. You can navigate through the pages in the report by either clicking on the pages listed below, or by using the keyword search tool below to find specific information within the annual report.-
 1
1 -
2
-
3
-
4
-
5
-
6
-
7
-
8
-
9
-
10
-
11
-
12
-
13
-
14
-
15
-
16
-
17
-
18
-
19
-
20
-
21
-
22
-
23
-
24
-
25
-
26
-
27
-
28
-
29
-
30
-
31
-
32
-
33
-
34
-
35
-
36
-
37
-
38
-
39
-
40
-
41
-
42
-
43
-
44
-
45
-
46
-
47
-
48
-
49
-
50
-
51
-
52
-
53
-
54
-
55
-
56
-
57
-
58
-
59
-
60
-
61
-
62
-
63
-
64
-
65
-
66
-
67
-
68
-
69
-
70
-
71
-
72
-
73
-
74
-
75
-
76
-
77
-
78
-
79
-
80
-
81
-
82
-
83
-
 84
84 -
 85
85 -
 86
86 -
 87
87 -
 88
88 -
 89
89 -
 90
90 -
 91
91 -
 92
92 -
 93
93 -
 94
94 -
 95
95 -
 96
96 -
 97
97 -
 98
98 -
 99
99 -
 100
100 -
 101
101 -
 102
102 -
 103
103 -
 104
104 -
105
-
106
-
107
-
108
-
109
-
110
-
111
-
112
-
113
-
114
-
115
-
116
-
117
-
118
-
119
-
120
-
121
-
122
-
123
-
124
-
125
-
126
-
127
-
128
-
129
-
130
-
131
-
132
-
133
-
134
-
135
-
136
-
137
-
138
-
139
-
140
-
141
-
142
-
143
-
144
-
145
-
146
-
147
-
148
-
149
-
150
-
151
-
152
-
153
-
154
-
155
-
156
-
157
-
158
-
159
-
160
-
161
-
162
-
163
-
164
 |
 |

82
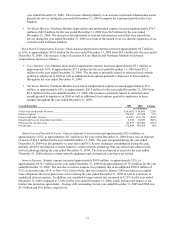
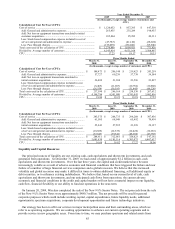
Northeast Markets Performance Measures
Set forth below is a summary of certain key performance measures for the periods indicated for our Northeast
Markets:
Year Ended December 31,
2009 2008 2007
(Dollars in thousands)
Northeast Markets Customers:
End of period ......................................................................................................................
.
778,911 104,151 —
Net additions.......................................................................................................................
.
674,760 104,151 —
Northeast Markets Adjusted EBITDA (Deficit) ..................................................................
.
$ (205,241) $ (118,618) $ (27,766)
As of December 31, 2009, our networks in our Northeast Markets cover a population of approximately 28
million.
Customers. Net customer additions in our Northeast Markets were 674,760 for the year ended December 31,
2009, compared to 104,151 for the year ended December 31, 2008. Total customers were 778,911 as of December
31, 2009 primarily due to the continued demand for our service offerings in the Philadelphia metropolitan area and
the launch of service in the New York and Boston metropolitan areas in early 2009.
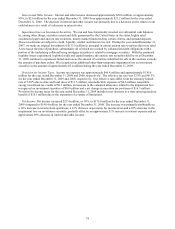
Segment Adjusted EBITDA (Deficit). Segment Adjusted EBITDA (Deficit) is presented in accordance with ASC
280 as it is the primary performance metric for which our reportable segments are evaluated and it is utilized by
management to facilitate evaluation of our ability to meet future debt service, capital expenditures and working
capital requirements and to fund future growth. For the year ended December 31, 2009, Northeast Markets Adjusted
EBITDA deficit was $205.2 million compared to an Adjusted EBITDA deficit of $118.6 million for the year ended
December 31, 2008. The increase in Northeast Markets Adjusted EBITDA deficit was attributable to the significant
increase in expenses related to launch expenses and the ramp up of operations in the Northeast Markets.
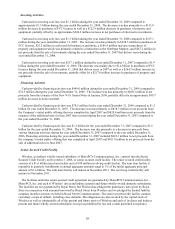
The following table shows a summary of certain quarterly key performance measures for the periods indicated for
our Northeast Markets.
Three Months Ended
March 31,
2008
June 30,
2008
September 30,
2008
December 31,
2008
March 31,
2009
June 30,
2009
September 30,
2009
December 31,
2009
(Dollars in thousands)
Northeast Markets Customers:
End of period ................................................... — — 44,622 104,151 352,946 545,886 666,484 778,911
Net additions.................................................... — — 44,622 59,529 248,795 192,940 120,598 112,427
Northeast Markets Adjusted EBITDA
(Deficit)........................................................... $ (14,728) $ (21,844) $ (35,440) $ (46,606) $ (69,424) $ (60,168) $ (43,631) $ (32,018)
Reconciliation of Non-GAAP Financial Measures
We utilize certain financial measures and key performance indicators that are not calculated in accordance with
GAAP to assess our financial and operating performance. A Non-GAAP financial measure is defined as a numerical
measure of a company’s financial performance that (i) excludes amounts, or is subject to adjustments that have the
effect of excluding amounts, that are included in the comparable measure calculated and presented in accordance
with GAAP in the statement of income or statement of cash flows; or (ii) includes amounts, or is subject to
adjustments that have the effect of including amounts, that are excluded from the comparable measure so calculated
and presented.
ARPU, CPGA, and CPU are non-GAAP financial measures utilized by our management to judge our ability to
meet our liquidity requirements and to evaluate our operating performance. We believe these measures are important
in understanding the performance of our operations from period to period, and although every company in the
wireless industry does not define each of these measures in precisely the same way, we believe that these measures
(which are common in the wireless industry) facilitate key liquidity and operating performance comparisons with
other companies in the wireless industry. The following tables reconcile our Non-GAAP financial measures with our
financial statements presented in accordance with GAAP.
ARPU — We utilize ARPU to evaluate our per-customer service revenue realization and to assist in forecasting our
future service revenues. ARPU is calculated exclusive of pass through charges that we collect from our customers
and remit to the appropriate government agencies.