Metro PCS 2009 Annual Report Download - page 116
Download and view the complete annual report
Please find page 116 of the 2009 Metro PCS annual report below. You can navigate through the pages in the report by either clicking on the pages listed below, or by using the keyword search tool below to find specific information within the annual report.-
 1
1 -
2
-
3
-
4
-
5
-
6
-
7
-
8
-
9
-
10
-
11
-
12
-
13
-
14
-
15
-
16
-
17
-
18
-
19
-
20
-
21
-
22
-
23
-
24
-
25
-
26
-
27
-
28
-
29
-
30
-
31
-
32
-
33
-
34
-
35
-
36
-
37
-
38
-
39
-
40
-
41
-
42
-
43
-
44
-
45
-
46
-
47
-
48
-
49
-
50
-
51
-
52
-
53
-
54
-
55
-
56
-
57
-
58
-
59
-
60
-
61
-
62
-
63
-
64
-
65
-
66
-
67
-
68
-
69
-
70
-
71
-
72
-
73
-
74
-
75
-
76
-
77
-
78
-
79
-
80
-
81
-
82
-
83
-
84
-
85
-
86
-
87
-
88
-
89
-
90
-
91
-
92
-
93
-
94
-
95
-
96
-
97
-
98
-
99
-
100
-
101
-
102
-
103
-
104
-
105
-
 106
106 -
 107
107 -
 108
108 -
 109
109 -
 110
110 -
 111
111 -
 112
112 -
 113
113 -
 114
114 -
 115
115 -
 116
116 -
 117
117 -
 118
118 -
 119
119 -
 120
120 -
 121
121 -
 122
122 -
 123
123 -
 124
124 -
 125
125 -
 126
126 -
127
-
128
-
129
-
130
-
131
-
132
-
133
-
134
-
135
-
136
-
137
-
138
-
139
-
140
-
141
-
142
-
143
-
144
-
145
-
146
-
147
-
148
-
149
-
150
-
151
-
152
-
153
-
154
-
155
-
156
-
157
-
158
-
159
-
160
-
161
-
162
-
163
-
164
 |
 |

F-2
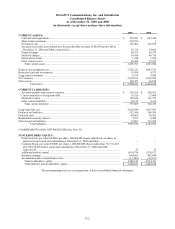
MetroPCS Communications, Inc. and Subsidiaries
Consolidated Balance Sheets
As of December 31, 2009 and 2008
(in thousands, except share and per share information)
2009 2008
CURRENT ASSETS:
Cash and cash equivalents ......................................................................................................... $ 929,381 $ 697,948
Short-term investments.............................................................................................................. 224,932 3
Inventories, net .......................................................................................................................... 147,401 155,955
Accounts receivable (net of allowance for uncollectible accounts of $2,045 and $4,106 at
December 31, 2009 and 2008, respectively)............................................................................ 51,536 34,666
Prepaid charges.......................................................................................................................... 48,353 56,347
Deferred charges........................................................................................................................ 59,414 49,716
Deferred tax assets..................................................................................................................... 1,948 1,832
Other current assets ................................................................................................................... 28,426 47,417
Total current assets................................................................................................................ 1,491,391 1,043,884
Property and equipment, net .......................................................................................................... 3,252,213 2,847,751
Restricted cash and investments .................................................................................................... 15,438 4,575
Long-term investments .................................................................................................................. 6,319 5,986
FCC licenses.................................................................................................................................. 2,470,181 2,423,074
Other assets.................................................................................................................................... 150,475 96,878
Total assets ................................................................................................................... $ 7,386,017 $ 6,422,148
CURRENT LIABILITIES:
Accounts payable and accrued expenses ................................................................................... $ 558,366 $ 568,432
Current maturities of long-term debt ......................................................................................... 19,326 17,009
Deferred revenue ....................................................................................................................... 187,654 151,779
Other current liabilities.............................................................................................................. 32,123 5,136
Total current liabilities .......................................................................................................... 797,469 742,356
Long-term debt, net ....................................................................................................................... 3,625,949 3,057,983
Deferred tax liabilities ................................................................................................................... 512,306 389,509
Deferred rents ................................................................................................................................ 80,487 56,425
Redeemable minority interest ........................................................................................................ 7,857 6,290
Other long-term liabilities.............................................................................................................. 73,807 135,262
Total liabilities.............................................................................................................. 5,097,875 4,387,825
COMMITMENTS AND CONTINGENCIES (See Note 11)
STOCKHOLDERS’ EQUITY:
Preferred stock, par value $0.0001 per share, 100,000,000 shares authorized; no shares of
preferred stock issued and outstanding at December 31, 2009 and 2008 ................................ — —
Common Stock, par value $0.0001 per share, 1,000,000,000 shares authorized, 352,711,263
and 350,918,272 shares issued and outstanding at December 31, 2009 and 2008,
respectively ............................................................................................................................. 35 35
Additional paid-in capital .......................................................................................................... 1,634,754 1,578,972
Retained earnings ...................................................................................................................... 664,693 487,849
Accumulated other comprehensive loss..................................................................................... (11,340) (32,533)
Total stockholders’ equity ..................................................................................................... 2,288,142 2,034,323
Total liabilities and stockholders’ equity............................................................................... $ 7,386,017 $ 6,422,148
The accompanying notes are an integral part of these consolidated financial statements.