Metro PCS 2009 Annual Report Download - page 88
Download and view the complete annual report
Please find page 88 of the 2009 Metro PCS annual report below. You can navigate through the pages in the report by either clicking on the pages listed below, or by using the keyword search tool below to find specific information within the annual report.-
 1
1 -
2
-
3
-
4
-
5
-
6
-
7
-
8
-
9
-
10
-
11
-
12
-
13
-
14
-
15
-
16
-
17
-
18
-
19
-
20
-
21
-
22
-
23
-
24
-
25
-
26
-
27
-
28
-
29
-
30
-
31
-
32
-
33
-
34
-
35
-
36
-
37
-
38
-
39
-
40
-
41
-
42
-
43
-
44
-
45
-
46
-
47
-
48
-
49
-
50
-
51
-
52
-
53
-
54
-
55
-
56
-
57
-
58
-
59
-
60
-
61
-
62
-
63
-
64
-
65
-
66
-
67
-
68
-
69
-
70
-
71
-
72
-
73
-
74
-
75
-
76
-
77
-
 78
78 -
 79
79 -
 80
80 -
 81
81 -
 82
82 -
 83
83 -
 84
84 -
 85
85 -
 86
86 -
 87
87 -
 88
88 -
 89
89 -
 90
90 -
 91
91 -
 92
92 -
 93
93 -
 94
94 -
 95
95 -
 96
96 -
 97
97 -
 98
98 -
99
-
100
-
101
-
102
-
103
-
104
-
105
-
106
-
107
-
108
-
109
-
110
-
111
-
112
-
113
-
114
-
115
-
116
-
117
-
118
-
119
-
120
-
121
-
122
-
123
-
124
-
125
-
126
-
127
-
128
-
129
-
130
-
131
-
132
-
133
-
134
-
135
-
136
-
137
-
138
-
139
-
140
-
141
-
142
-
143
-
144
-
145
-
146
-
147
-
148
-
149
-
150
-
151
-
152
-
153
-
154
-
155
-
156
-
157
-
158
-
159
-
160
-
161
-
162
-
163
-
164
 |
 |
76
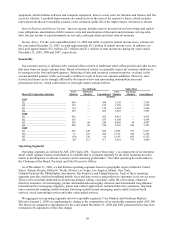
Service Revenues. Service revenues increased $518.1 million, or approximately 27%, to $2.4 billion for the year
ended December 31, 2008 from $1.9 billion for the year ended December 31, 2007. The increase is due to increases
in Core Markets and Northeast Markets service revenues as follows:
•Core Markets. Core Markets service revenues increased approximately $505.7 million, or 26%, to $2.4
billion for the year ended December 31, 2008 from $1.9 billion for the year ended December 31, 2007. The
increase in service revenues is primarily attributable to net customer additions of approximately 1.3 million
customers for the year ended December 31, 2008, which accounted for approximately $607.3 million of the
Core Markets increase. This increase was partially offset by the higher participation in our Family Plans as
well as reduced revenue from certain features included in our service plans that were previously provided a la
carte, accounting for an approximately $106.6 million decrease.
•Northeast Markets. Northeast Markets service revenues were approximately $12.4 million for the year ended
December 31, 2008. These service revenues are attributable to net customer additions of 104,151 in the
Philadelphia metropolitan area for the year ended December 31, 2008.
Equipment Revenues. Equipment revenues decreased $2.3 million, or approximately 1%, to $314.3 million for the
year ended December 31, 2008 from $316.6 million for the year ended December 31, 2007. The decrease is due
primarily to a decrease in Core Markets equipment revenues, partially offset by an increase in Northeast Markets
equipment revenues as follows:
•Core Markets. Core Markets equipment revenues decreased approximately $6.1 million, or approximately
2%, to approximately $310.5 million for the year ended December 31, 2008 from $316.6 million for the year
ended December 31, 2007. The decrease in equipment revenues is primarily attributable to a lower average
price of handsets activated reducing equipment revenues by $39.9 million, partially offset by an increase in
gross additions and an increase in upgrade handset sales to existing customers accounting for an approximate
$30.6 million increase in equipment revenues.
•Northeast Markets. Northeast Markets equipment revenues were $3.8 million for the year ended December
31, 2008. These equipment revenues are attributable to gross customer additions from the launch of service
in the Philadelphia metropolitan area.
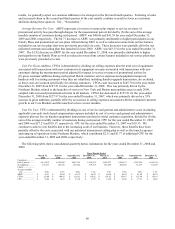
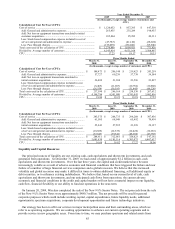
Cost of Service. Cost of service increased $209.8 million, or approximately 32%, to $857.3 million for the year
ended December 31, 2008 from $647.5 million for the year ended December 31, 2007. The increase is due primarily
to an increase in Core Markets and Northeast Markets cost of service as follows:
•Core Markets. Core Markets cost of service increased approximately $143.4 million, or 22%, to
approximately $785.6 million for the year ended December 31, 2008 from $642.2 million for the year ended
December 31, 2007. The increase in cost of service is primarily attributable to the approximate 33% growth
in our Core Markets customer base and the deployment of additional network infrastructure during the year
ended December 31, 2008.
•Northeast Markets. Northeast Markets cost of service increased approximately $66.4 million to $71.7 million
for the year ended December 31, 2008 from $5.3 million for the year ended December 31, 2007. The
increase in cost of service is primarily attributable to the expenses associated with the construction and
launch of service in the Philadelphia metropolitan area and operating costs in the New York and Boston
metropolitan areas that were incurred prior to the launch of service in these markets.
Cost of Equipment. Cost of equipment increased $107.4 million, or 18%, to $704.6 million for the year ended
December 31, 2008 from $597.2 million for the year ended December 31, 2007. The increase is due primarily to an
increase in Core Markets and Northeast Markets cost of equipment as follows:
•Core Markets. Core Markets cost of equipment increased approximately $93.1 million, or approximately
16%, to approximately $690.3 million for the year ended December 31, 2008 from $597.2 million for the
year ended December 31, 2007. The increase in Core Markets cost of equipment is primarily attributable to
an increase in gross customer additions which accounted for approximately $73.5 million, coupled with an
increase in upgrade handset sales to existing customers accounting for approximately $38.8 million. These
increases were partially offset by a lower average cost of handsets activated reducing cost of equipment by
$27.7 million.