Metro PCS 2009 Annual Report Download - page 155
Download and view the complete annual report
Please find page 155 of the 2009 Metro PCS annual report below. You can navigate through the pages in the report by either clicking on the pages listed below, or by using the keyword search tool below to find specific information within the annual report.-
 1
1 -
2
-
3
-
4
-
5
-
6
-
7
-
8
-
9
-
10
-
11
-
12
-
13
-
14
-
15
-
16
-
17
-
18
-
19
-
20
-
21
-
22
-
23
-
24
-
25
-
26
-
27
-
28
-
29
-
30
-
31
-
32
-
33
-
34
-
35
-
36
-
37
-
38
-
39
-
40
-
41
-
42
-
43
-
44
-
45
-
46
-
47
-
48
-
49
-
50
-
51
-
52
-
53
-
54
-
55
-
56
-
57
-
58
-
59
-
60
-
61
-
62
-
63
-
64
-
65
-
66
-
67
-
68
-
69
-
70
-
71
-
72
-
73
-
74
-
75
-
76
-
77
-
78
-
79
-
80
-
81
-
82
-
83
-
84
-
85
-
86
-
87
-
88
-
89
-
90
-
91
-
92
-
93
-
94
-
95
-
96
-
97
-
98
-
99
-
100
-
101
-
102
-
103
-
104
-
105
-
106
-
107
-
108
-
109
-
110
-
111
-
112
-
113
-
114
-
115
-
116
-
117
-
118
-
119
-
120
-
121
-
122
-
123
-
124
-
125
-
126
-
127
-
128
-
129
-
130
-
131
-
132
-
133
-
134
-
135
-
136
-
137
-
138
-
139
-
140
-
141
-
142
-
143
-
144
-
 145
145 -
 146
146 -
 147
147 -
 148
148 -
 149
149 -
 150
150 -
 151
151 -
 152
152 -
 153
153 -
 154
154 -
 155
155 -
 156
156 -
 157
157 -
 158
158 -
 159
159 -
 160
160 -
 161
161 -
 162
162 -
 163
163 -
 164
164
 |
 |

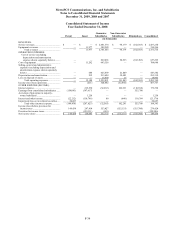
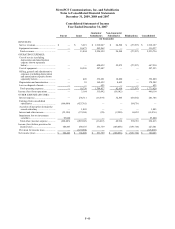
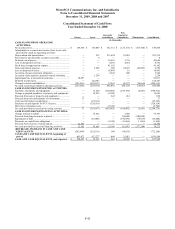
MetroPCS Communications, Inc. and Subsidiaries
Notes to Consolidated Financial Statements
December 31, 2009, 2008 and 2007
F-41
Consolidated Statement of Cash Flows
Year Ended December 31, 2009
Parent Issuer
Guarantor
Subsidiaries
Non-Guarantor
Subsidiaries Eliminations Consolidated
(in thousands)
CASH FLOWS FROM OPERATING
ACTIVITIES:
Net income (loss) ....................................................... . $ 176,844 $ 174,388 $ 553,413 $ (151,055) $ (576,746) $ 176,844
Adjustments to reconcile net income (loss) to net
cash provided by (used in) operating activities:
Depreciation and amortization ................................... — 228 325,589 52,039 — 377,856
Provision for uncollectible accounts receivable ........ — 199 — — — 199
Deferred rent expense ................................................ — — 20,107 4,115 — 24,222
Cost of abandoned cell sites....................................... — — 5,274 3,012 — 8,286
Stock-based compensation expense........................... — — 47,783 — — 47,783
Non-cash interest expense.......................................... — 11,309 — — — 11,309
(Gain) loss on disposal of assets ................................ — — (4,884) 201 — (4,683)
Gain on sale of investments ....................................... (644) — — —— (644)
Accretion of asset retirement obligations .................. — — 4,380 731 — 5,111
Accretion of put option in majority-owned
subsidiary ................................................................. — 1,567 — — — 1,567
Impairment loss in investment securities................... 2,386 — — — — 2,386
Deferred income taxes................................................ — 110,925 (764) — — 110,161
Changes in assets and liabilities................................. 80,199 (324,674) (175,735) (994) 560,156 138,952
Net cash provided by (used in) operating
activities ................................................................... 258,785 (26,058) 775,163 (91,951) (16,590) 899,349
CASH FLOWS FROM INVESTING
ACTIVITIES:
Purchases of property and equipment........................ — (9,177) (757,503) (64,994) — (831,674)
Change in prepaid purchases of property and
equipment................................................................. — (33,115) — — — (33,115)
Proceeds from sale of plant and equipment ............... — — 434 4,896 — 5,330
Purchase of investments............................................. (486,645) — — — — (486,645)
Proceeds from sale and maturity of investments ....... 262,500 — — — — 262,500
Change in restricted cash and investments ................ — (15,113) — — — (15,113)
Purchases of and deposits for FCC licenses .............. — (3,800) (11,717) — — (15,517)
Proceeds from exchange of FCC licenses.................. — — 949 — — 949
Issuance of related party debt..................................... — (465,000) — — 465,000 —
Proceeds from related party debt ............................... — 296,700 — — (296,700) —
Microwave relocation costs ....................................... ——(3,669) — — (3,669)
Net cash used in investing activities .......................... (224,145) (229,505) (771,506) (60,098) 168,300 (1,116,954)
CASH FLOWS FROM FINANCING
ACTIVITIES:
Change in book overdraft........................................... — (17,047) — (3,267) — (20,314)
Proceeds from long-term loan.................................... — — — 465,000 (465,000) —
Proceeds from 9 ¼% Senior Notes Due 2014 ........... — 492,250 — — — 492,250
Debt issuance costs .................................................... — (11,925) — — — (11,925)
Repayment of debt ..................................................... — (16,000) — (296,700) 296,700 (16,000)
Payments on capital lease obligations ....................... — — (3,599) (16,590) 16,590 (3,599)
Proceeds from exercise of stock options.................... 8,626 — — — — 8,626
Net cash provided by (used in) financing
activities ................................................................... 8,626 447,278 (3,599) 148,443 (151,710) 449,038
INCREASE (DECREASE) IN CASH AND
CASH EQUIVALENTS ........................................ 43,266 191,715 58 (3,606) — 231,433
CASH AND CASH EQUIVALENTS,
beginning of period ................................................ 598,823 78,121 624 20,380 —697,948
CASH AND CASH EQUIVALENTS, end of
period....................................................................... $ 642,089 $ 269,836 $ 682 $ 16,774 $ — $ 929,381