Metro PCS 2009 Annual Report Download - page 135
Download and view the complete annual report
Please find page 135 of the 2009 Metro PCS annual report below. You can navigate through the pages in the report by either clicking on the pages listed below, or by using the keyword search tool below to find specific information within the annual report.-
 1
1 -
2
-
3
-
4
-
5
-
6
-
7
-
8
-
9
-
10
-
11
-
12
-
13
-
14
-
15
-
16
-
17
-
18
-
19
-
20
-
21
-
22
-
23
-
24
-
25
-
26
-
27
-
28
-
29
-
30
-
31
-
32
-
33
-
34
-
35
-
36
-
37
-
38
-
39
-
40
-
41
-
42
-
43
-
44
-
45
-
46
-
47
-
48
-
49
-
50
-
51
-
52
-
53
-
54
-
55
-
56
-
57
-
58
-
59
-
60
-
61
-
62
-
63
-
64
-
65
-
66
-
67
-
68
-
69
-
70
-
71
-
72
-
73
-
74
-
75
-
76
-
77
-
78
-
79
-
80
-
81
-
82
-
83
-
84
-
85
-
86
-
87
-
88
-
89
-
90
-
91
-
92
-
93
-
94
-
95
-
96
-
97
-
98
-
99
-
100
-
101
-
102
-
103
-
104
-
105
-
106
-
107
-
108
-
109
-
110
-
111
-
112
-
113
-
114
-
115
-
116
-
117
-
118
-
119
-
120
-
121
-
122
-
123
-
124
-
 125
125 -
 126
126 -
 127
127 -
 128
128 -
 129
129 -
 130
130 -
 131
131 -
 132
132 -
 133
133 -
 134
134 -
 135
135 -
 136
136 -
 137
137 -
 138
138 -
 139
139 -
 140
140 -
 141
141 -
 142
142 -
 143
143 -
 144
144 -
 145
145 -
146
-
147
-
148
-
149
-
150
-
151
-
152
-
153
-
154
-
155
-
156
-
157
-
158
-
159
-
160
-
161
-
162
-
163
-
164
 |
 |

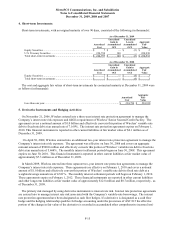
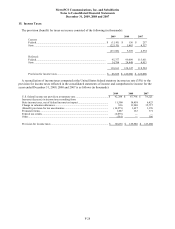
MetroPCS Communications, Inc. and Subsidiaries
Notes to Consolidated Financial Statements
December 31, 2009, 2008 and 2007
F-21
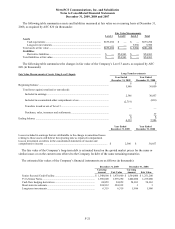
The following table summarizes assets and liabilities measured at fair value on a recurring basis at December 31,
2008, as required by ASC 820 (in thousands):
Fair Value Measurements
Level 1 Level 2 Level 3 Total
Assets
Cash equivalents .................................................................................. $675,294 $ — $ — $675,294
Long-term investments ........................................................................ — — 5,986 5,986
Total assets at fair value ............................................................................. $675,294 $ — $ 5,986 $681,280
Liabilities
Derivative liabilities............................................................................. $ — $54,963 $ — $54,963
Total liabilities at fair value........................................................................ $ — $54,963 $ — $54,963
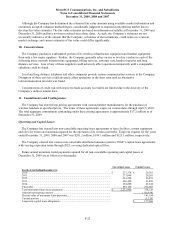
The following table summarizes the changes in fair value of the Company’s Level 3 assets, as required by ASC
820 (in thousands):
Fair Value Measurements of Assets Using Level 3 Inputs Long-Term Investments
Year Ended Year Ended
December 31, 2009 December 31, 2008
Beginning balance .......................................................................................................
.
$
5,986
$
36,050
Total losses (gains) (realized or unrealized):
Included in earnings ...........................................................................................
.
2,386 30,857
Included in accumulated other comprehensive loss............................................
.
(2,719) (830)
Transfers in and/or out of Level 3 ......................................................................
.
——
Purchases, sales, issuances and settlements........................................................
.
—37
Ending balance ............................................................................................................
.
$
6,319
$
5,986
Year Ended Year Ended
December 31, 2009 December 31, 2008
Losses included in earnings that are attributable to the change in unrealized losses
relating to those assets still held at the reporting date as reported in impairment
loss on investment securities in the consolidated statements of income and
comprehensive income ............................................................................................... $ 2,386 $ 30,857
The fair value of the Company’s long-term debt is estimated based on the quoted market prices for the same or
similar issues or on the current rates offered to the Company for debt of the same remaining maturities.
The estimated fair values of the Company’s financial instruments are as follows (in thousands):
December 31, 2009 December 31, 2008
Carrying
Amount Fair Value
Carrying
Amount Fair Value
Senior Secured Credit Facility...........................................................
.
$ 1,548,000 $ 1,470,600 $ 1,564,000 $ 1,251,200
9¼% Senior Notes.............................................................................
.
1,950,000 1,979,250 1,400,000 1,239,000
Cash flow hedging derivatives...........................................................
.
24,859 24,859 54,963 54,963
Short-term investments......................................................................
.
224,932 224,932 3 3
Long-term investments......................................................................
.
6,319 6,319 5,986 5,986